

Introduction
Suzlon Energy Limited, India’s pioneer and market leader in wind energy solutions, officially published its unaudited consolidated and standalone financial results for the first quarter of the financial year 2026-27 (Q1 FY27) on July 28, 2026. The quarter brought a classic contrast between top-line expansion and bottom-line pressure.
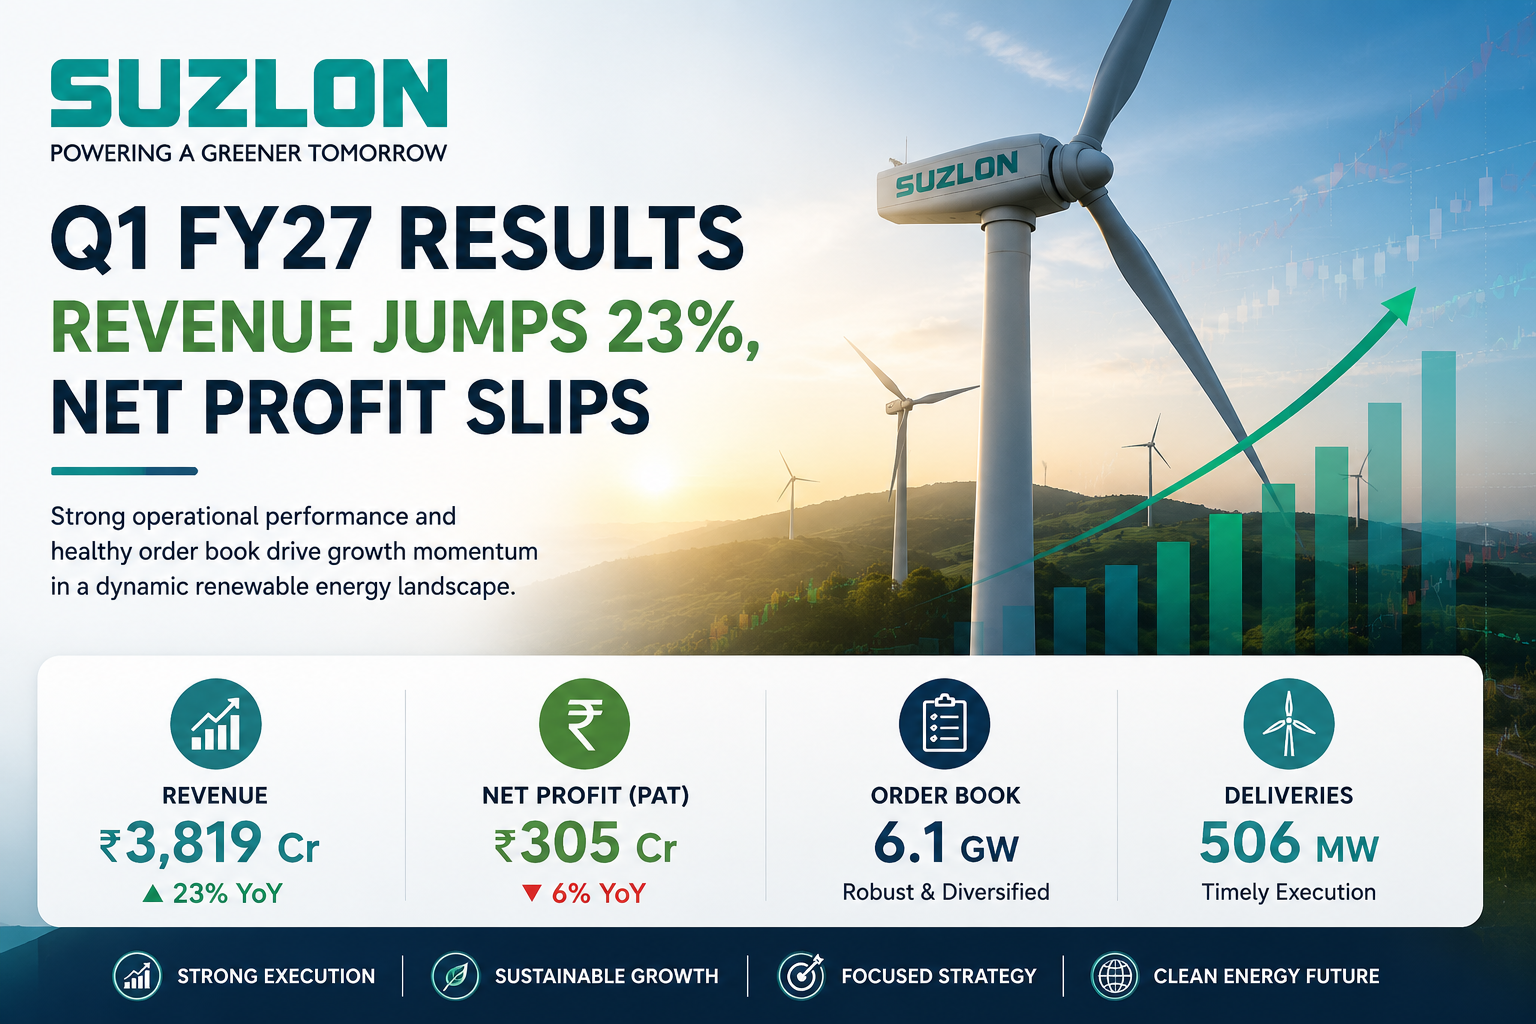
Driven by a record-high delivery volume for any first quarter, Suzlon generated consolidated revenue from operations of ₹3,819.36 crore, marking an impressive 22.52% year-on-year increase. However, higher execution costs, scope adjustments in Engineering, Procurement, and Construction (EPC) projects, and elevated logistics costs weighed on overall operating margins. Consequently, consolidated net profit after tax (PAT) slipped 5.89% year-on-year to ₹305.22 crore.
Market participants reacted sharply to the margin compression and net profit miss relative to consensus estimates, leading to a nearly 10% drop in Suzlon’s share price on the day of the release. Despite the short-term stock market volatility, the company’s underlying fundamentals demonstrate continuous operational scaling. Suzlon secured approximately 1 GW of new orders during the period, driving its cumulative order book to a robust 6,135 MW (6.1 GW). Furthermore, the company launched its “Suzlon 2.0” strategic architecture, dividing operations into four core growth engines: RE Tech, RE DevCo, RE Projects, and RE Asset Management Services (RE AMS).
Below is an exhaustive, fact-based breakdown of Suzlon’s Q1 FY27 financial report, segment dynamics, balance sheet resilience, peer comparison, SWOT analysis, and long-term investment outlook.
Quick Highlights
The following table provides a quick consolidated summary of Suzlon Energy’s financial and operational performance for Q1 FY27 compared against prior periods:
Key Financial Highlights Summary
| Financial Metric | Q1 FY27 (Unaudited) | Q4 FY26 (Audited/Ref) | Q1 FY26 (Unaudited) | YoY Growth (%) | QoQ Growth (%) |
| Deliveries (MW) | 506 MW | 830 MW | 444 MW | +13.96% | -39.04% |
| Commissioning (MW) | 269 MW | N/A | 117 MW | +129.91% | N/A |
| Revenue from Operations | ₹3,819.36 Cr | ₹5,468.06 Cr | ₹3,117.33 Cr | +22.52% | -30.15% |
| Total Income | ₹3,862.53 Cr | ₹5,520.65 Cr | ₹3,165.19 Cr | +22.03% | -30.04% |
| EBITDA | ₹595.00 Cr | ₹964.00 Cr | ₹599.00 Cr | -0.67% | -38.28% |
| EBITDA Margin (%) | 15.58% | 17.63% | 19.22% | -364 bps | -205 bps |
| Profit Before Tax (PBT) | ₹389.47 Cr | ₹833.24 Cr | ₹459.23 Cr | -15.19% | -53.26% |
| Net Profit After Tax (PAT) | ₹305.22 Cr | ₹1,114.35 Cr | ₹324.32 Cr | -5.89% | -72.61% |
| Basic & Diluted EPS (₹) | ₹0.22* | ₹0.81 | ₹0.24* | -8.33% | -72.84% |
| Cumulative Order Book | 6,135 MW | 5,697 MW | 5,025 MW (Mar ’25) | +22.09% | +7.69% |
| Net Cash Balance | ₹2,322.00 Cr | ₹2,384.00 Cr | ₹1,943.00 Cr (Mar ’25) | +19.51% | -2.60% |
| Gross Borrowings | ₹277.00 Cr | ₹264.00 Cr | ₹283.00 Cr (Mar ’25) | -2.12% | +4.92% |
| Share Price Reaction | ₹48.02 | – | – | -9.65% (Day Loss) | Intraday Low: ₹47.84 |
*Note: Earnings Per Share (EPS) for quarterly periods is not annualised.
About Suzlon Energy Ltd.
Business Overview
Suzlon Energy Limited is India’s market leader in wind turbine manufacturing and full-stack renewable energy services. Established over three decades ago, the company has played an instrumental role in shaping India’s wind energy landscape. As of June 30, 2026, Suzlon maintains an installed global wind capacity of over 22 GW across 17 countries and holds a dominant 28% cumulative market share in India.
The company employs an experienced workforce of over 8,600 professionals spanning research and development, manufacturing, project management, and asset care.
+-----------------------------------------------------------------------------------+
|                                   SUZLON 2.0                                      |
|                       Full-Stack Renewable Energy Architecture                     |
+-------------------------+-------------------------+-------------------------------+
|    1. RE TECH           |   2. RE DEVCO           |   3. RE PROJECTS              |
|    Wind | Solar | BESS  |   Shovel-Ready Sites   |   Turnkey EPC Execution       |
+-------------------------+-------------------------+-------------------------------+
|    4. RE ASSET MANAGEMENT SERVICES (RE AMS)                                       |
|    16.1+ GW Fleet Maintenance | Multi-Brand Renom Platform (3.6 GW AUM)            |
+-----------------------------------------------------------------------------------+
Business Segments & “Suzlon 2.0” Architecture
During Q1 FY27, Suzlon realigned its reportable segment names under its strategic vision titled “Suzlon 2.0” to better reflect its evolving multi-technology offerings:
Renewable Energy Solutions (Formerly Wind Turbine Generator Segment): Focuses on designing, engineering, and manufacturing wind turbine generators (WTGs), along with integrated solar and Battery Energy Storage Systems (BESS) solutions.
RE Asset Management Services (Formerly Operation & Maintenance Service Segment): Operates as India’s largest wind asset management platform, maintaining over 16.1 GW of domestic capacity and managing multi-brand fleets through its subsidiary, Renom Energy Services.
Foundry & Forging (SE Forge Limited): Manufactures high-specification castings and forgings for industrial equipment, supplying both internal turbine requirements and external global clients.
RE DevCo & RE Projects: Identifies shovel-ready renewable projects, secures land and grid access, and carries out turnkey execution.
Key Products & Global Footprint
Suzlon’s product lineup spans multiple turbine generations engineered specifically for low and medium wind regimes:
S120 (2.10 MW Platform): Rotors with a 120-meter diameter and hub heights up to 140 meters, ideal for repowering smaller legacy sites.
S144 (3.15 MW – 3.30 MW Platform): The current mainstream workhorse in India, featuring a 144-meter rotor diameter and lattice/tubular tower heights up to 160 meters.
S175 (5.x MW Platform): Next-generation flagship platform featuring a 175-meter rotor diameter, custom-designed for low-wind sites and Firm and Dispatchable Renewable Energy (FDRE) applications. The first unit was installed in May 2026.
S163 (6.x MW Platform): High-capacity turbine currently under development for medium to high-wind regimes, planned for initial installation in H1 2027.
Q1 FY27 Financial Performance Analysis
Income Statement Breakdown
Suzlon Energy reported a consolidated total revenue from operations of ₹3,819.36 crore for Q1 FY27, up from ₹3,117.33 crore in Q1 FY26. Total expenditure during the quarter rose to ₹3,473.06 crore compared to ₹2,705.96 crore in the corresponding quarter of the previous year. The increase in expenditure was largely driven by higher consumption of raw materials and operational component costs, which scaled in tandem with higher delivery volumes.
Consolidated Revenue vs Expenses (Q1 FY27 vs Q1 FY26 in ₹ Cr)
=============================================================
Q1 FY27  [Revenue: ₹3,819.36 Cr] =========================>
         [Expenses: ₹3,473.06 Cr] =====================>
-------------------------------------------------------------
Q1 FY26  [Revenue: ₹3,117.33 Cr] ===================>
         [Expenses: ₹2,705.96 Cr] =================>
Consolidated Income Statement
The following table presents the formal, detailed consolidated financial income statement for the quarter ended June 30, 2026, alongside historical comparative quarters:
| Particulars (in ₹ Crore) | Q1 FY27 (Unaudited) | Q4 FY26 (Audited/Ref) | Q1 FY26 (Unaudited) | FY26 Full Year |
| Revenue from Operations | 3,819.36 | 5,468.06 | 3,117.33 | 16,679.11 |
| Other Operating Income | 9.73 | 25.19 | 14.39 | 52.73 |
| Other Income | 33.44 | 27.40 | 33.47 | 109.94 |
| Total Income | 3,862.53 | 5,520.65 | 3,165.19 | 16,841.78 |
| Raw Material & Component Costs | 2,942.39 | 3,525.97 | 2,463.68 | 11,433.58 |
| Changes in Inventories (WIP & Finished) | (445.71) | 179.22 | (550.00) | (630.86) |
| Employee Benefits Expense | 268.00 | 262.99 | 254.02 | 1,100.47 |
| Finance Costs | 133.62 | 135.16 | 103.07 | 462.15 |
| Depreciation & Amortisation Expense | 105.59 | 92.98 | 70.24 | 318.45 |
| Foreign Exchange Loss / (Gain) | 8.79 | 26.89 | 3.80 | 39.81 |
| Other Operating Expenses | 460.38 | 534.20 | 361.15 | 1,766.46 |
| Total Expenses | 3,473.06 | 4,757.41 | 2,705.96 | 14,490.06 |
| Profit Before Exceptional Items & Tax | 389.47 | 763.24 | 459.23 | 2,351.72 |
| Exceptional Items Gain / (Loss) | 0.00 | 70.00 | 0.00 | 70.00 |
| Profit Before Tax (PBT) | 389.47 | 833.24 | 459.23 | 2,421.72 |
| Current Tax | 0.55 | 3.21 | 0.81 | 7.56 |
| Deferred Tax Charge / (Credit) | 83.70 | (284.32) | 134.10 | (749.23) |
| Net Profit After Tax (PAT) | 305.22 | 1,114.35 | 324.32 | 3,163.39 |
| Other Comprehensive Income / (Loss) | (1.23) | 4.77 | 5.04 | 8.01 |
| Total Comprehensive Income | 303.99 | 1,119.12 | 329.36 | 3,171.40 |
| Paid-up Equity Capital (Face Value ₹2) | 2,750.61 | 2,744.99 | 2,741.83 | 2,744.99 |
| Basic EPS (₹)* | 0.22 | 0.81 | 0.24 | 2.31 |
| Diluted EPS (₹)* | 0.22 | 0.81 | 0.24 | 2.31 |
*Note: Non-annualised quarterly EPS.
Balance Sheet & Capital Structure Snapshot
Suzlon’s balance sheet reflects the results of its debt deleveraging efforts in recent years. As of June 30, 2026, consolidated net worth stood at ₹9,869 crore, up from ₹9,464 crore as of March 31, 2026.
Consolidated Balance Sheet Summary
| Balance Sheet Line Item (in ₹ Crore) | June 30, 2026 (Unaudited) | March 31, 2026 (Audited) | March 31, 2025 (Audited) |
| Tangible & Non-Current Assets | 3,855.00 | 3,965.00 | 2,637.00 |
| Inventories | 5,172.00 | 4,512.00 | 3,234.00 |
| Trade Receivables | 5,890.00 | 6,487.00 | 3,866.00 |
| Cash & Cash Equivalents | 2,599.00 | 2,648.00 | 2,227.00 |
| Other Current Assets | 1,372.00 | 1,257.00 | 996.00 |
| Total Assets | 18,888.00 | 18,869.00 | 12,960.00 |
| Net Worth | 9,869.00 | 9,464.00 | 6,106.00 |
| Total Borrowings (Current & Non-Current) | 277.00 | 264.00 | 283.00 |
| Other Non-Current Liabilities | 1,107.00 | 1,115.00 | 810.00 |
| Trade Payables & Current Liabilities | 7,635.00 | 8,026.00 | 5,761.00 |
| Total Equity & Liabilities | 18,888.00 | 18,869.00 | 12,960.00 |
| Net Cash Position (Cash Less Borrowings) | 2,322.00 | 2,384.00 | 1,943.00 |
Segment Revenue & Profitability Analysis
Segment Revenue Performance
Suzlon derives its primary operating income from three major business verticals:
Renewable Energy Solutions: Generated ₹3,174.31 crore in gross segment revenue during Q1 FY27, representing an 27.25% year-on-year increase compared to ₹2,494.57 crore in Q1 FY26.
RE Asset Management Services (RE AMS): Delivered gross revenue of ₹631.88 crore, growing 8.12% YoY from ₹584.45 crore in Q1 FY26.
Foundry & Forging (SE Forge): Recorded gross segment revenue of ₹125.86 crore, down from ₹146.49 crore in Q1 FY26 due to internal supply allocation shifts.
Detailed Segment Breakdown
| Segment Revenue & Results (in ₹ Crore) | Q1 FY27 (Unaudited) | Q4 FY26 (Ref) | Q1 FY26 (Unaudited) | FY26 Full Year |
| Segment Gross Revenue | ||||
| – Renewable Energy Solutions | 3,174.31 | 4,741.71 | 2,494.57 | 14,040.19 |
| – RE Asset Management Services | 631.88 | 695.17 | 584.45 | 2,483.85 |
| – Foundry & Forging | 125.86 | 167.78 | 146.49 | 596.49 |
| – Others | 2.20 | 1.38 | 1.61 | 7.90 |
| Total Segment Revenue | 3,934.25 | 5,606.04 | 3,227.12 | 17,128.43 |
| Less: Inter-segment Revenue | (114.89) | (137.98) | (109.79) | (449.32) |
| Consolidated Operating Revenue | 3,819.36 | 5,468.06 | 3,117.33 | 16,679.11 |
| Segment Operating Profit (EBIT) | ||||
| – Renewable Energy Solutions | 264.37 | 594.46 | 338.51 | 1,853.79 |
| – RE Asset Management Services | 212.06 | 255.03 | 169.84 | 759.23 |
| – Foundry & Forging | 11.74 | 20.76 | 19.63 | 86.27 |
| – Others | 1.48 | 0.75 | 0.85 | 4.64 |
| Total Segment EBIT | 489.65 | 871.00 | 528.83 | 2,703.93 |
| Finance Costs | (133.62) | (135.16) | (103.07) | (462.15) |
| Other Income | 33.44 | 27.40 | 33.47 | 109.94 |
| Exceptional Gain / (Loss) | 0.00 | 70.00 | 0.00 | 70.00 |
| Consolidated Profit Before Tax (PBT) | 389.47 | 833.24 | 459.23 | 2,421.72 |
Order Book Analysis
Suzlon’s cumulative order book expanded to 6,135 MW (6.1 GW) as of July 2026, providing operational revenue visibility over the next 18 to 24 months.
Order Book Composition (6,135 MW)
=================================
By Client Segment:
[Captive / C&I / Retail: 70%] =========================================>
[Central & State Auctions: 16%] ========>
[Public Sector (PSUs): 14%] ======>

By Execution Scope:
[Non-EPC (Supply & Installation): 68%] ===============================>
[EPC (Turnkey Execution): 32%] ================>

By Turbine Platform:
[S144 (3.x MW Platform): 88%] ===========================================>
[S120 (2.1 MW Platform): 10%] =====>
[S175 (5.x MW Platform): 2%] =>
Key Order Highlights & Scope Dynamics
High-Margin C&I Dominance: Commercial and Industrial (C&I) and captive customers account for 70% of the total order book. PSU orders comprise 14%, while state/central auctions make up 16%.
Expanding EPC Footprint: The proportion of EPC (Engineering, Procurement, and Construction) scope orders increased from 22% in Q1 FY26 to 32% in Q1 FY27. While EPC projects offer higher total revenue realization per megawatt, they typically carry lower gross percentage margins compared to pure WTG supply contracts, contributing to the quarterly margin drop.
Major Project Wins: Key order additions during the quarter include landmark orders from Tata Power, Waaree Group, and Sunsure Energy. The company is also executing a 1.2 GW order for NTPC Renewable Energy in Gujarat.
Management Commentary & Conference Call Highlights
During the earnings release, Suzlon’s executive leadership team addressed operational developments, strategy, and market conditions:
Girish Tanti, Vice Chairman, Suzlon Group:
“Suzlon is stronger than ever, and we’re leveraging this to invest in our future. Suzlon 2.0 is underway as we build 4 strategic growth engines with wind-led RE solutions, strengthen our technology, and focus on long-term customer partnerships. All new growth areas are gaining traction. The S175-5.x MW had a strong debut and the S144-3.x MW order book is building significant momentum.”
Ajay Kapur, Chief Executive Officer, Suzlon Group:
“Our strong start to FY27 reflects disciplined execution across every aspect of our business. We achieved our highest-ever first quarter deliveries of 506 MW, up +14% y-o-y, while more than doubling our commissioning as projects moved into advanced stages of execution. With the successful launch of first FDRE-ready S175 wind turbine and manufacturing now scaled at our Bhuj facility, we are well-prepared to meet future demand.”
Rahul Jain, Chief Financial Officer, Suzlon Group:
“We delivered a strong top-line performance this quarter, with revenue growing 23% year-on-year, reflecting healthy execution and project deliveries. EBITDA & PAT margins were in line with ongoing developments, given the temporary logistic disruptions arising from the geopolitical situation, certain strategic investments, and change of scope and segment mix.”
Indian & Global Renewable Energy Sector Analysis
National Energy Transition Framework
India’s power consumption is projected to nearly triple by 2047, growing from 1,600 TWh in 2025 to 4,490 TWh by 2047. To meet this demand, total renewable capacity must expand from roughly 220 GW in 2026 to 1,600 GW by 2047. Wind capacity is projected to expand at a 10% CAGR, growing from 57 GW in 2026 to 100 GW by 2030, and reaching 400 GW by 2047.
India Wind Capacity Trajectory Target (in GW)
=============================================
2026* : [57 GW]  =======>
2030  : [100 GW] ============>
2035  : [160 GW] ===================>
2047  : [400 GW] ========================================================>
Growth Drivers
Data Centers & Industrial Electrification: Urbanization, EV adoption, and data center growth are driving structural increases in baseload power needs.
FDRE & Hybrid Tenders: Central procurement agencies (SECI, NTPC, NHPC) are increasingly issuing Firm and Dispatchable Renewable Energy (FDRE) tenders requiring integrated wind-solar-storage configurations.
Repowering Potential: The National Institute of Wind Energy (NIWE) estimates India’s repowering potential at ~25.4 GW, allowing legacy 500 kW to 1 MW sites to be replaced with 3 MW+ turbines.
Peer Comparison
Suzlon operates in a competitive domestic and international landscape. Its primary listed onshore peer in India is Inox Wind Limited, while solar module manufacturers like Waaree Energies and project developers like KPI Green Energy operate in adjacent clean energy sub-sectors.
Peer Comparison Table (Q1 FY27 Figures / Trailing Metrics)
| Metric | Suzlon Energy Ltd. | Inox Wind Ltd. | KPI Green Energy | Waaree Energies |
| Q1 FY27 Revenue (₹ Cr) | 3,819.36 | ~640.00 | ~380.00 | ~3,400.00 |
| Q1 FY27 Net Profit (₹ Cr) | 305.22 | ~90.00 | ~65.00 | ~310.00 |
| EBITDA Margin (%) | 15.58% | ~21.50% | ~28.00% | ~14.20% |
| Order Book (GW) | 6.135 GW | ~3.30 GW | ~1.80 GW | ~16.00 GW |
| Net Cash / (Debt) (₹ Cr) | +2,322.00 | -(450.00) | -(320.00) | +1,850.00 |
| Market Position | #1 Wind OEM India | #2 Wind OEM India | Solar/Hybrid EPC | #1 Solar Module OEM |
| Trailing P/E Ratio | ~42.5x | ~58.0x | ~38.0x | ~35.0x |
Key Financial Ratios Analysis
Evaluating Suzlon’s Q1 FY27 financial results using key performance ratios illustrates both operational strengths and areas of near-term margin friction:
Key Financial Ratios Snapshot
| Financial Ratio | Formula / Basis | Q1 FY27 Value | Q1 FY26 Value | Financial Interpretation |
| Gross Contribution Margin | (Contribution / Revenue) | 32.07% | 35.10% | Down due to higher EPC scope mix and freight charges. |
| EBITDA Margin | (EBITDA / Operating Revenue) | 15.58% | 19.22% | Affected by overhead scaling and logistics. |
| Net Profit Margin | (PAT / Operating Revenue) | 7.99% | 10.40% | Lower gross margins and higher depreciation. |
| Return on Equity (ROE) | (Annualised PAT / Net Worth) | 12.37% | 21.25% | Normalized following recent balance sheet expansion. |
| Return on Capital Employed | (Annualised EBIT / Total Capital) | 19.35% | 28.40% | Reflects capital deployments in manufacturing lines. |
| Net Debt to Equity | ((Debt – Cash) / Net Worth) | -0.24 (Net Cash) | -0.32 (Net Cash) | Clean balance sheet with substantial liquidity reserves. |
| Interest Coverage Ratio | (EBIT / Finance Cost) | 3.66x | 5.13x | Debt service obligations remain manageable. |
SWOT Analysis
+-----------------------------------------------------------------------------------+
|                                 SWOT ANALYSIS                                     |
+---------------------------------------------------+-------------------------------+
|  STRENGTHS                                        |  WEAKNESSES                   |
|  - 28% market share & 22+ GW installed base   |  - Margins vulnerable to scope mix |
|  - Net cash balance of ₹2,322 Cr            |  - Low capacity utilization at SE Forge |
|  - Integrated multi-brand O&M platform       |                               |
+---------------------------------------------------+-------------------------------+
|  OPPORTUNITIES                                    |  THREATS                      |
|  - 100+ GW wind target by 2030              |  - Global freight disruptions & tariffs|
|  - Commercialization of S175 5 MW platform   |  - Right-of-Way & land access delays |
|  - Expanding repowering market (~25.4 GW)    |  - Aggressive pricing competition    |
+---------------------------------------------------+-------------------------------+
Strengths
Dominant Market Share & Scale: Commands a 28% market share in Indian wind installations, backed by 22+ GW installed globally.
Balance Sheet Stability: Maintains a net cash position of ₹2,322 crore, eliminating solvency concerns.
Annuity Service Revenue: The RE AMS division generates recurring, high-margin cash flows from maintaining over 16.1 GW of wind assets.
Weaknesses
Margin Sensitivity: Earnings remain sensitive to changes in raw material costs, freight rates, and execution scope (EPC vs Non-EPC).
Foundry Capacity Headroom: SE Forge’s capacity utilization stood at 32% during Q1 FY27, representing unutilized potential.
Opportunities
Government Policy Support: National targets requiring 100+ GW of wind capacity by 2030 provide long-term demand visibility.
S175 5 MW Commercial Rollout: The introduction of higher-yield 5.x MW turbines lowers the Levelized Cost of Energy (LCOE) and opens up low-wind sites.
Repowering Legacy Fleets: Repowering older, smaller turbines represents a potential ~25.4 GW market opportunity.
Threats
Supply Chain Bottlenecks: Geopolitical tensions affecting maritime logistics can delay component imports and elevate freight expenses.
Land & Transmission Delays: Site-erection constraints and delays in substation construction can slow project commissioning timelines.
Share Price Analysis & Market Reaction
Following the release of the Q1 FY27 earnings report on July 28, 2026, Suzlon Energy’s stock experienced sharp selling pressure on both the NSE and BSE.
Suzlon Share Price Action (July 28, 2026)
=========================================
Previous Close : ₹53.15
Opening Price  : ₹52.40
Intraday High  : ₹52.80
Intraday Low   : ₹47.84
Closing Price  : ₹48.02 (-9.65%)
Trading Volume : ~185 Million Shares (Aggressive Institutional Selling)
Why Did the Stock Fall Despite 23% Revenue Growth?
Missed Consensus Profit Estimates: Consolidated net profit of ₹305.22 crore missed average analyst consensus estimates of ~₹400 crore.
EBITDA Margin Compression: EBITDA margins contracted by 364 basis points YoY to 15.58%, impacted by scope changes and supply chain disruptions.
Sequential Profit Decline: Profit fell significantly compared to Q4 FY26 (₹1,114.35 crore), although the prior quarter benefited from deferred tax adjustments.
What Analysts May Watch Next
Margin Trajectory in Q2 & Q3 FY27: Whether EBITDA margins stabilize back toward the 17%–18% range as supply chain bottlenecks clear.
Execution Rate of Order Book: The conversion speed of the 6.1 GW order backlog into completed deliveries.
S175 Platform Scaling: Commercial adoption metrics and blade production scaling at the Bhuj and Jaisalmer facilities.
Resolution of Legal Matters: Progress on the appeal filed before the Securities Appellate Tribunal (SAT) regarding SEBI’s ₹15.95 crore penalty attribution.
Investment Thesis: Bull vs. Bear Case
Bull Case
Unmatched Scale: Positioned to capture a significant share of India’s projected 100+ GW wind growth target.
Clean Balance Sheet: Net cash position of ₹2,322 crore allows the company to fund capital expenditures without adding debt.
High-Margin Services Growth: The RE AMS segment provides a steady base of recurring revenue.
Bear Case
Execution Vulnerabilities: Supply chain logistics and site access issues could periodically weigh on quarterly earnings.
Margin Compression Risks: A higher mix of EPC projects could constrain percentage margins.
Valuation Sensitivities: Trading at a high P/E multiple leaves little margin for error if earnings miss expectations.
Key Takeaways (15 Fact-Based Summary Points)
Suzlon reported Q1 FY27 consolidated revenue from operations of ₹3,819.36 crore (+22.52% YoY).
Consolidated net profit fell 5.89% YoY to ₹305.22 crore, below consensus expectations.
Highest-ever Q1 delivery volume of 506 MW (+13.96% YoY).
Project commissioning more than doubled YoY to 269 MW.
Consolidated EBITDA stood at ₹595 crore, with margins compressing to 15.58%.
Cumulative order book reached 6,135 MW (6.1 GW) as of July 2026.
Commercial and Industrial (C&I) clients account for 70% of the total order book.
Non-EPC contracts make up 68% of orders, while EPC projects represent 32%.
Net cash balance stood at ₹2,322 crore as of June 30, 2026.
Doubled Jaisalmer rotor blade manufacturing capacity to 1,260 MW.
Unveiled the “Suzlon 2.0” multi-engine organizational strategy.
Realigned segment names to Renewable Energy Solutions and RE Asset Management Services.
Approved setting up a wholly owned subsidiary in Singapore for international OMS expansion.
Appealed SEBI’s penalty order before the Securities Appellate Tribunal (SAT).
Suzlon’s share price fell 9.65% to close at ₹48.02 following the earnings update.



