

Introduction
Coal India Limited (CIL), the world’s largest coal producer and India’s premier Maharatna public sector enterprise, released its unaudited standalone and consolidated financial results for the first quarter of Financial Year 2026-27 (Q1 FY27) on July 27, 2026. Operating under the administrative control of the Ministry of Coal, Coal India provides the energy backbone for the Indian economy, supplying over 80% of the thermal coal consumed by the nation’s power utilities.
The company’s quarterly performance serves as a key macro indicator for India’s broader industrial health, electricity demand trajectory, and infrastructure expansion momentum. During Q1 FY27, Coal India navigated fluctuating seasonal power demand, ongoing shifts in global energy commodity prices, and evolving domestic regulatory frameworks—most notably state-level mineral land cesses.
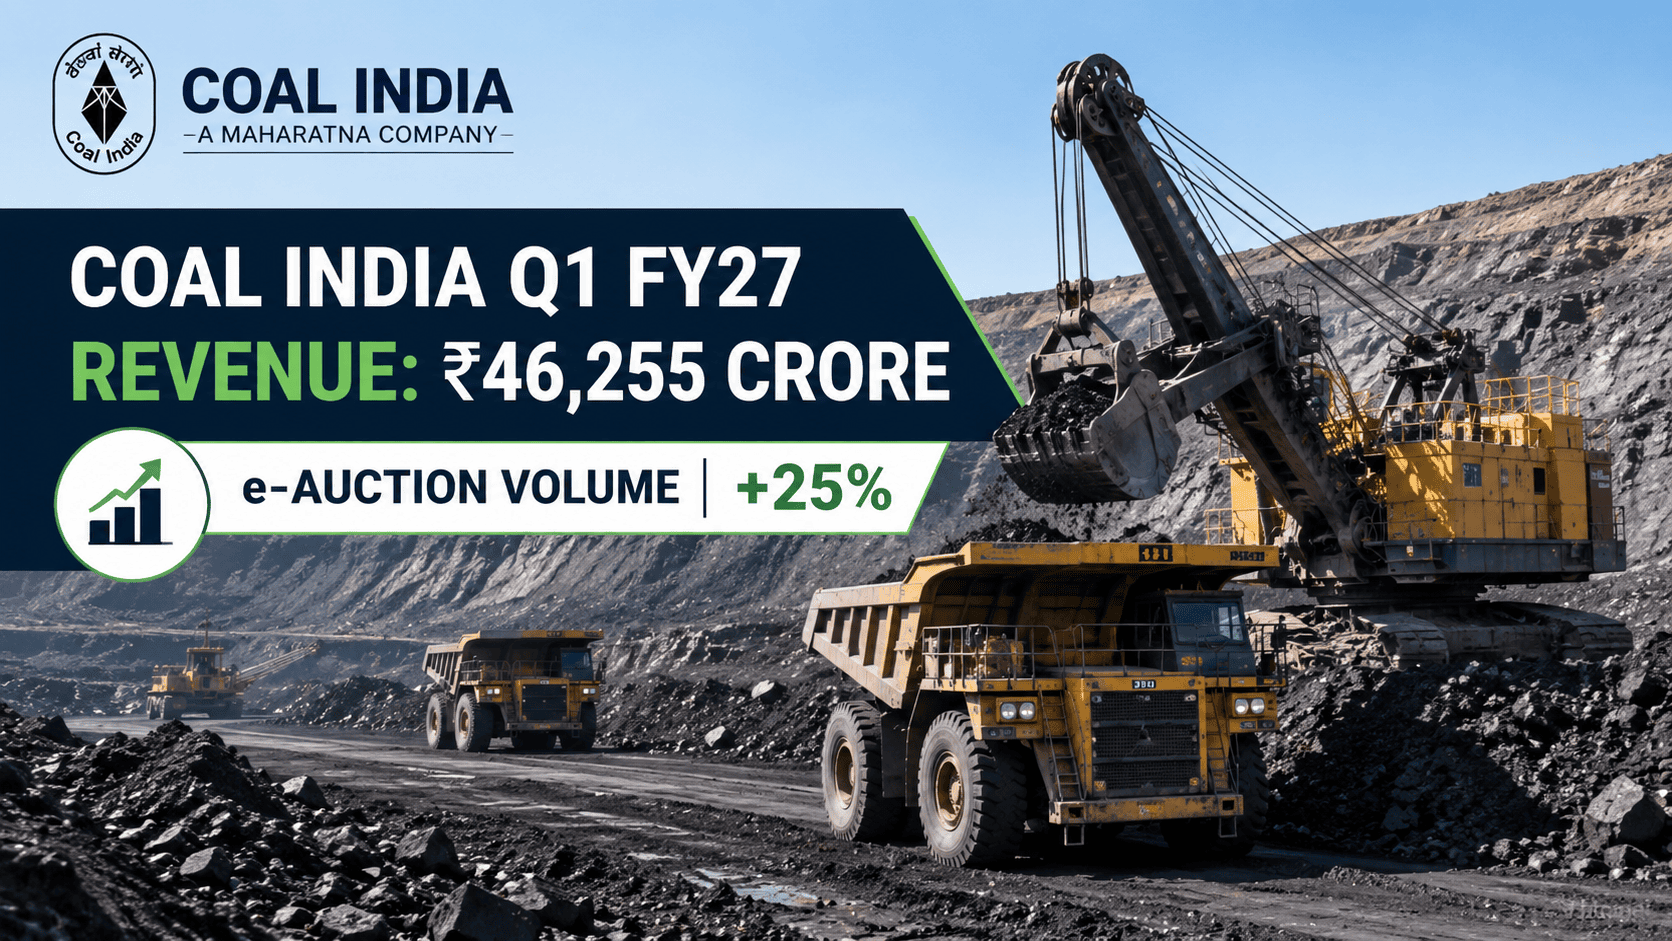
Despite operational challenges in certain mining subsidiaries due to local environmental factors, Coal India delivered a steady set of financial numbers. Top-line revenue from operations expanded 8% Year-on-Year (YoY) to ₹46,255 Crore, while consolidated Net Profit (Profit After Tax) reached ₹8,850 Crore. Concurrently, the state-owned miner advanced its long-term diversification strategy into commercial solar power generation and coal gasification, recording its first-ever revenues from green power sales during the quarter.
For global investors, institutional asset managers, and retail equity market participants, Coal India represents a unique blend of near-monopolistic domestic market dominance, high dividend yield potential, robust cash generation, and an active strategic transition toward cleaner energy forms.
Company Overview
Established in November 1975 following the nationalization of Indian coal mines, Coal India Limited operates across 8 Indian states through its 7 wholly-owned coal-producing subsidiaries. It also operates a specialized mine planning and consultancy arm, Central Mine Planning & Design Institute Limited (CMPDIL).
+-----------------------------------------------------------------------------------+
|                              COAL INDIA LIMITED (CIL)                             |
|                        World's Largest Coal Producer / Maharatna PSU              |
+-----------------------------------------------------------------------------------+
                                          |
     +------------------------------------+------------------------------------+
     |                                                                         |
+----+-------------------------------+                    +--------------------+-------------------------------+
|    COAL MINING SUBSIDIARIES        |                    |   MINE PLANNING & DIVERSIFICATION          |
+------------------------------------+                    +----------------------------------------------------+
| • Eastern Coalfields Ltd (ECL)     |                    | • CMPDIL (Mine Planning & Design)                  |
| • Bharat Coking Coal Ltd (BCCL)    |                    | • CIL Solar PV Limited (Renewable Energy)          |
| • Central Coalfields Ltd (CCL)     |                    | • CIL Navikarniya Urja Ltd (Green Projects)        |
| • Northern Coalfields Ltd (NCL)    |                    | • Bharat Coal Gasification & Chemicals (BCGCL)     |
| • Western Coalfields Ltd (WCL)     |                    | • Critical Mineral Acquisition Units               |
| • South Eastern Coalfields (SECL)  |                    |                                                    |
| • Mahanadi Coalfields Ltd (MCL)    |                    |                                                    |
+------------------------------------+                    +----------------------------------------------------+
Business Structure & Operational Profile
| Operating Parameter | Corporate Specification |
| Parent Entity | Coal India Limited (Government of India holds ~63.13% equity stake) |
| Core Subsidiaries | ECL, BCCL, CCL, NCL, WCL, SECL, MCL, CMPDIL |
| Joint Ventures | Bharat Coal Gasification & Chemicals Ltd (BCGCL JV with BHEL), NTPC-CIL Power Co |
| Market Dominance | ~80% of total domestic coal production in India |
| Primary Customers | Power Generation Utilities (Thermal Power Plants), Steel, Cement, Captive Power |
| Primary Pricing Schemes | Fuel Supply Agreements (FSA), e-Auctions, Washed Coking Coal |
| Logistics Capabilities | Rail Network & MGR (Mass Rapid Transit), Road Transports, Conveyor Systems |
Q1 FY27 Results Snapshot
In its official disclosure to the National Stock Exchange (NSE) and BSE Limited on July 27, 2026, Coal India presented its physical performance metrics alongside its audited standalone and unaudited consolidated financial results for the quarter ended June 30, 2026.
+-----------------------------------------------------------------------------------+
|                   COAL INDIA Q1 FY27 FINANCIAL & OPERATIONAL HIGHLIGHTS           |
+-----------------------------------------------------------------------------------+
|  • Revenue from Operations: ₹46,255 Crore     (+8% YoY)                             |
|  • Consolidated EBITDA:     ₹14,349 Crore     (+0.01% YoY)                         |
|  • Profit Before Tax (PBT): ₹11,719 Crore     (-0.5% YoY)                          |
|  • Profit After Tax (PAT):  ₹8,850 Crore      (+0.7% YoY)                          |
|  • Total Coal Offtake:      197.86 Million Tonnes (+4% YoY)                       |
|  • e-Auction Volume:        26.52 Million Tonnes  (+25% YoY)                       |
|  • e-Auction Realization:   ₹3,085.44 per Tonne   (+6% YoY)                        |
|  • Gross Sales Realization: ₹2,276.62 per Tonne   (+3% YoY)                        |
+-----------------------------------------------------------------------------------+
Key Financial & Operational Summary Table
All monetary figures in ₹ Crore unless specified otherwise
| Parameter | Q1 FY27 (Actual) | Q1 FY26 (Actual) | YoY Change (%) | Operational Context |
| Coal Production | 169.63 MT | 183.32 MT | -7% | Operational adjustments in BCCL, NCL, MCL |
| Coal Offtake (Sales Volume) | 197.86 MT | 190.96 MT | +4% | Sustained power plant demand dispatch |
| Overburden Removal (OBR) | 504.68 M.CuM | 508.31 M.CuM | -1% | Contractual OBR at 89% total volume |
| Gross Sale of Product | ₹45,135 Cr | ₹42,081 Cr | +7% | Stronger e-Auction realization & volumes |
| Services & Other Operating Revenues | ₹1,120 Cr | ₹839 Cr | +34% | Reversal of stripping activity provisions |
| Revenue from Operations | ₹46,255 Cr | ₹42,919 Cr | +8% | Solid top-line revenue expansion |
| Other Income | ₹2,040 Cr | ₹1,616 Cr | +26% | Higher interest yields on bank deposits |
| Total Revenue / Income | ₹48,295 Cr | ₹44,535 Cr | +8% | Combined top-line and treasury growth |
| Total Operating Expenditure | ₹36,816 Cr | ₹32,903 Cr | +12% | Driven by rates, taxes, & material costs |
| EBITDA | ₹14,349 Cr | ₹14,348 Cr | +0.01% | Operating cash flow stability |
| EBITDA Margin on Revenue | 31.00% | 33.00% | -200 bps | Controlled cost inflation impact |
| Profit Before Tax (PBT) | ₹11,719 Cr | ₹11,776 Cr | -0.5% | Incorporates ₹240 Cr share of JV profits |
| Tax Expense | ₹2,870 Cr | ₹2,988 Cr | -4% | Effective tax rate at ~24.5% |
| Profit After Tax (PAT) | ₹8,850 Cr | ₹8,788 Cr | +0.7% | Stable bottom-line earnings |
| Net Profit Margin | 19.00% | 18.00% | +100 bps | Marginal improvement in net profitability |
| Basic & Diluted EPS | ₹14.36 | ₹14.26 | +0.7% | Non-annualized quarterly earning per share |
Detailed Performance Highlights
1. Revenue & Realization Analysis
Coal India’s consolidated revenue from operations grew by 8% YoY to reach ₹46,255 Crore in Q1 FY27. This growth was primarily driven by higher e-Auction sales volumes and elevated realization per tonne across key delivery channels.
+-----------------------------------------------------------------------------------+
|                       COAL INDIA REALIZATION BREAKDOWN (Q1 FY27)                  |
+-----------------------------------------------------------------------------------+
|  • FSA Volume:        168.07 MT  | Realization: ₹2,099.41 / Ton (+1.1% YoY)     |
|  • e-Auction Volume:   26.52 MT  | Realization: ₹3,085.44 / Ton (+5.8% YoY)     |
|  • Washed & Other:      3.64 MT  | Realization: ₹4,567.80 / Ton (+10.4% YoY)    |
|  • Overall Sales:     198.23 MT  | Realization: ₹2,276.62 / Ton (+3.1% YoY)     |
+-----------------------------------------------------------------------------------+
Realization Breakdown by Channel (Gross Billing Basis)
Data sourced from CIL Investor Presentation Q1 FY27
| Channel Category | Q1 FY27 Volume (MT) | Q1 FY26 Volume (MT) | Q1 FY27 Price (₹/Ton) | Q1 FY26 Price (₹/Ton) | Financial Impact (₹ Cr) PDF |
| Fuel Supply Agreement (FSA) | 168.07 | 165.77 | 2,099.41 | 2,076.15 | +₹870 Cr (Vol: +479 Cr, Price: +391 Cr) |
| e-Auction Segment | 26.52 | 21.25 | 3,085.44 | 2,917.22 | +₹1,981 Cr (Vol: +1535 Cr, Price: +446 Cr) |
| Washed Coal & Others | 3.64 | 3.54 | 4,567.80 | 4,136.16 | +₹198 Cr (Vol: +41 Cr, Price: +157 Cr) |
| Overall Weighted Total | 198.23 | 190.56 | 2,276.62 | 2,208.23 | +₹3,054 Cr Total Product Sales Growth |
Crucially, e-Auction sales volume surged by 24.8% YoY to 26.52 Million Tonnes. Prices realized under e-Auctions increased to ₹3,085.44 per tonne (gross basis), representing a premium over long-term FSA contract rates and expanding top-line revenue.
2. Expense Structure Analysis
Total expenditure for Q1 FY27 rose by 12% YoY to ₹36,816 Crore. Examining specific line items highlights key operational cost movements:
                            +-----------------------------------+
                            | TOTAL EXPENDITURE: ₹36,816 Cr     |
                            |           (+12% YoY)              |
                            +-----------------------------------+
                                              |
                                              v
+-----------------------------------------------------------------------------------+
|                        PRIMARY COST DRIVERS (Q1 FY27)                             |
+-----------------------------------------------------------------------------------+
|  1. Rates & Taxes: Expanded by ₹1,246 Cr to ₹11,658 Cr (Jharkhand Cess Impact)    |
|  2. Materials Consumed: Rose 27% to ₹3,260 Cr (Driven by Explosives & Fuel)       |
|  3. Contractual Expenses: Increased 11% to ₹8,658 Cr (Outsourcing Coal/OB Removal) |
|  4. Employee Expenses: Well-controlled at ₹11,023 Cr (+0.4% YoY)                  |
+-----------------------------------------------------------------------------------+
Employee Benefits Expense: Remained flat at ₹11,023 Crore (+0.4% YoY). A favorable change in the actuarial discount rate (from 6.3% to 6.8%) resulted in a ₹94 Crore reduction in gratuity and leave encashment liabilities, offsetting uniform reimbursement provisions of ₹132 Crore booked during the quarter.
Rates & Taxes (Other Expenses): Expanded to ₹11,658 Crore (up ₹1,436 Crore or 14% YoY). This increase was primarily driven by higher overall coal offtake volumes and the imposition of the Jharkhand Mineral-Bearing Land Cess.
Cost of Materials Consumed: Rose 27% YoY to ₹3,260 Crore, due to a ₹244 Crore increase in explosives costs and a ₹435 Crore expansion in Heavy Earth Moving Machinery (HEMM) fuel and lubricant expenses.
Contractual Expenses: Increased 11% YoY to ₹8,658 Crore, driven by higher outsourcing fees for coal mining and overburden removal (up ₹784 Crore).
3. Production, Offtake & Inventory Dynamics
Total raw coal production in Q1 FY27 stood at 169.63 Million Tonnes, down 7% compared to 183.32 MT in Q1 FY26. Despite the production dip caused by localized operational constraints, total coal offtake increased by 4% YoY to 197.86 Million Tonnes.
To meet demand during the peak summer power burn, Coal India drew down its pithead raw coal stocks by 28.93 Million Tonnes (a 22% reduction) relative to March 31, 2026, leaving closing inventory at 101.35 Million Tonnes as of June 30, 2026.
Transport Mode Split
Railways & MGR Systems: Handled 133 Million Tonnes (~67% of total dispatch).
Road Transportation: Transported 62 Million Tonnes (~31% of total dispatch).
Conveyor / Other Modes: Handled 3 Million Tonnes.
Subsidiary-Wise Performance Analysis
Coal India operates through its core mining subsidiaries. The table below outlines the standalone Profit Before Tax (PBT) and Profit After Tax (PAT) contributions across operating units:
Subsidiary Performance Breakdown (Q1 FY27 vs Q1 FY26)
Figures in ₹ Crore
| Subsidiary Entity | PBT (Q1 FY27) | PBT (Q1 FY26) | PBT YoY (%) | PAT (Q1 FY27) | PAT (Q1 FY26) | PAT YoY (%) | Operational Drivers |
| Eastern Coalfields (ECL) | ₹517 Cr | ₹256 Cr | +102% | ₹377 Cr | ₹178 Cr | +112% | Strong offtake expansion (+12% YoY) |
| Bharat Coking Coal (BCCL) | (₹103 Cr) | ₹247 Cr | -142% | (₹68 Cr) | ₹177 Cr | -138% | Production impacted (-27% YoY) |
| Central Coalfields (CCL) | ₹1,019 Cr | ₹906 Cr | +12% | ₹830 Cr | ₹661 Cr | +26% | Production up 10%, Offtake up 16% |
| Northern Coalfields (NCL) | ₹3,397 Cr | ₹3,631 Cr | -6% | ₹2,616 Cr | ₹2,737 Cr | -4% | High efficiency; minor volume trim |
| Western Coalfields (WCL) | ₹974 Cr | ₹1,132 Cr | -14% | ₹729 Cr | ₹847 Cr | -14% | Higher material and transport costs |
| South Eastern Coalfields (SECL) | ₹2,139 Cr | ₹1,982 Cr | +8% | ₹1,519 Cr | ₹1,418 Cr | +7% | Production (+7%) and Offtake (+5%) growth |
| Mahanadi Coalfields (MCL) | ₹3,226 Cr | ₹3,221 Cr | +0.2% | ₹2,399 Cr | ₹2,448 Cr | -2% | Highest profit contributor; robust volumes |
| CMPDIL (Consultancy) | ₹160 Cr | ₹95 Cr | +68% | ₹116 Cr | ₹76 Cr | +54% | Increased mine planning assignments |
| CIL Standalone (Excl Div) | ₹211 Cr | ₹175 Cr | +20% | ₹153 Cr | ₹116 Cr | +32% | Treasury income and administration fees |
| CIL Consolidated Total | ₹11,719 Cr | ₹11,776 Cr | -0.5% | ₹8,850 Cr | ₹8,788 Cr | +0.7% | Stable consolidated performance |
Major Strategic Developments & Green Initiatives
During Q1 FY27, Coal India advanced several long-term structural and ESG initiatives designed to diversify its revenue base and reduce carbon intensity:
+-----------------------------------------------------------------------------------+
|                      STRATEGIC & GREEN INITIATIVES (Q1 FY27)                      |
+-----------------------------------------------------------------------------------+
|  1. Commercial Coal Gasification: Laid foundation stone for BCGCL's ₹25,000 Cr    |
|     Ammonium Nitrate project (CIL-BHEL JV). Capacity: 6.6 Lakh Tonnes/year.       |
|  2. First Solar Energy Revenue: Recorded ₹5.68 Cr from 100 MW Bhadramali Solar     |
|     plant in Gujarat following GEDA commissioning.                                |
|  3. Khavda Solar Expansion: Commissioned 200 MW out of 300 MW project in Gujarat.   |
|  4. Coking Coal Washeries: Commercial operations began at Bhojudih (BCCL),         |
|     expanding washing capacity to 17.35 MTPA.                                     |
|  5. Revenue-Sharing MDO: ASGKCC mine started operations, contributing 9% revenue  |
|     share to BCCL.                                                                |
+-----------------------------------------------------------------------------------+
Commercial Coal Gasification (BCGCL JV): On June 20, 2026, the foundation stone was laid for India’s first commercial coal gasification plant under Bharat Coal Gasification & Chemicals Limited (a JV between CIL and BHEL). With an estimated investment of ₹25,000 Crore, the facility will produce 6.6 Lakh Tonnes of Ammonium Nitrate annually.
First Commercial Solar Energy Revenue: Coal India officially recorded its first revenue from commercial green power sales, generating ₹5.68 Crore in Q1 FY27 following GEDA commissioning of its 100 MW Solar Power Plant at Bhadramali, Gujarat.
Khavda Solar Expansion: On July 8, 2026, Coal India commissioned an additional 200 MW of solar power capacity within its 300 MW solar park project at Khavda, Gujarat.
Coal Washing Capacity Expansion: On May 26, 2026, BCCL commissioned the 2.0 MTPA Bhojudih Coal Washery. This increased BCCL’s total coal washing capacity to 17.35 MTPA, expanding domestic coking coal processing capabilities for Indian steelmakers.
Mine Developer and Operator (MDO) Revenue Sharing: Production commenced at the ASGKCC Mine under BCCL using a revenue-sharing MDO model, providing BCCL with a 9% top-line revenue cut.
Key Financial Ratios & Balance Sheet Health
Coal India maintains a net-debt-free balance sheet with robust quick liquidity.
Financial Ratios Summary Table
Data extracted from CIL Q1 FY27 Exchange Disclosures
| Ratio Metric | Q1 FY27 (June 30, 2026) | FY26 (March 31, 2026) | Analytical Insights |
| Debt-Equity Ratio | 0.12x | 0.12x | Conservative capital structure with minimal borrowing |
| Current Ratio | 1.90x | 1.86x | Liquidity expanded due to short-term bank deposit growth |
| Quick Ratio | 1.70x | 1.62x | High coverage over short-term obligations |
| Debtors Turnover (Months) | 0.79 Months | 0.81 Months | Trade receivables reduced to ₹15,834 Cr |
| Inventory Turnover (Months) | 1.22 Months | 1.22 Months | Inventory utilization aligned with seasonal demand |
| EBITDA Margin on Revenue | 31.00% | 32.00% | Operating margins remained stable YoY |
| Net Profit Margin | 19.00% | 18.00% | Bottom-line efficiency improved by 100 bps YoY |
| Book Value Per Share | ₹206.91 | ₹193.26 | Net Worth expanded on retained earnings |
| Quarterly EPS (Not Annualized) | ₹14.36 | ₹50.46 (Full FY26) | Basic & Diluted EPS per share |
Peer Comparison Table
A comparison of Coal India against domestic and international mining utilities highlights its relative valuation and operating scale:
| Enterprise Name | Country | Primary Product | Market Cap (Approx ₹ Cr) | P/E Ratio (TTM) | EV/EBITDA | Dividend Yield (%) | Net Profit Margin (%) |
| Coal India (CIL) | India | Thermal / Coking Coal | ~₹3,10,000 Cr | ~7.8x | ~4.2x | ~5.5% – 6.5% | 19.0% |
| NLC India Limited | India | Lignite / Thermal Power | ~₹38,000 Cr | ~18.5x | ~8.1x | ~1.8% | ~11.2% |
| China Shenhua Energy | China | Coal Mining / Power | ~$115 Billion | ~10.2x | ~5.8x | ~6.2% | ~18.5% |
| Yancoal Australia | Australia | Export Thermal Coal | ~$8.5 Billion | ~6.5x | ~3.8x | ~8.2% | ~22.0% |
Coal India trades at lower valuation multiples than domestic power generation PSUs, reflecting market assumptions regarding long-term carbon transition risks while offering higher dividend yields.
SWOT Analysis
+-----------------------------------------------------------------------------------+
|                                 SWOT ANALYSIS                                     |
+-----------------------------------------------------------------------------------+
|  STRENGTHS                                 |  WEAKNESSES                          |
|  • Monopoly position (~80% Indian output)  |  • High contractual mining costs     |
|  • Net-debt-free balance sheet (0.12x D/E) |  • Exposure to state mineral cesses  |
|  • Strong cash reserves & treasury returns |  • Low coking coal output share      |
|                                            |                                      |
|  OPPORTUNITIES                             |  THREATS                             |
|  • Solar expansion (300 MW Khavda park)    |  • Accelerating renewable transition |
|  • Coal gasification (BCGCL JV)            |  • Monsoon disruptions to mining     |
|  • Critical mineral acquisitions           |  • Rail wagon availability bottlenecks|
+-----------------------------------------------------------------------------------+
Strengths
Near-Monopolistic Dominance: Produces four-fifths of India’s coal, benefiting from long-term demand from thermal power utilities.
Balance Sheet Stability: Debt-to-equity ratio of 0.12x with Current Ratio expanding to 1.90x.
High Treasury Returns: Other Income generated ₹2,040 Crore in Q1 FY27 from short-term bank deposits.
Weaknesses
Cost Exposure to Local Taxes: State cesses, such as the Jharkhand Mineral-Bearing Land Cess, add directly to operating overhead.
Contractual Execution Dependence: Contractual mining accounts for 89% of overburden removal and 69% of raw coal production.
Opportunities
Clean Energy Diversification: Scaling solar power capacity toward 3,000 MW alongside commercial coal gasification.
Threats
Accelerating Grid Decarbonization: Long-term displacement of coal-fired generation by renewable energy and battery storage.
Comprehensive Risk Analysis
Investors in Coal India should account for key structural and operational risks:
Regulatory & Tax Risks: Recent legal rulings allowing state governments to levy cesses on mineral-bearing land create cost volatility across operating subsidiaries.
Monsoon Impact on Mining: Heavy monsoon rainfall in Q2 typically floods open-cast mines, temporarily reducing production volumes and raising overburden removal expenses.
Rail Logistics Bottlenecks: Dispatch depends heavily on Indian Railways wagon availability. Any shortage of rakes can lead to pithead inventory accumulation.
Dividend Analysis & History
Coal India remains one of the top dividend-paying blue-chip stocks on the Indian stock exchanges, supported by consistent free cash flow generation.
+-----------------------------------------------------------------------------------+
|                          DIVIDEND PROFILE & CASH FLOW STRENGTH                    |
+-----------------------------------------------------------------------------------+
|  • Historical Dividend Payout Ratio:  50% – 70% of Annual Consolidated PAT        |
|  • Trailing Dividend Yield Range:     5.5% – 6.5% at current market prices          |
|  • Dividend Payout Timing:            Typically two interim dividends (Nov & Feb)  |
|                                       followed by a final dividend (May/June).    |
+-----------------------------------------------------------------------------------+
For FY26, Coal India paid total dividends of ₹25.50 per equity share. Given Q1 FY27 consolidated net profits of ₹8,850 Crore (EPS of ₹14.36), the company remains on track to maintain its annual dividend distribution strategy, providing income security for long-term investors.
Investor Suitability Matrix
| Investor Profile | Suitability | Strategic Rationale |
| Dividend / Income Investors | Highly Suitable | Robust free cash flow and a net-debt-free balance sheet support consistent dividend yields. |
| Value Investors | Suitable | Low P/E (~7.8x) and EV/EBITDA (~4.2x) multiples offer defensive valuation margins. |
| Long-Term Growth Investors | Moderately Suitable | Core coal volumes are mature, but solar power and gasification offer long-term upside. |
| Short-Term Tactical Traders | Suitable on Dips | High volume liquidity allows tactical positioning around quarterly e-Auction realization updates. |
Key Takeaways
Top-Line Revenue Expansion: Consolidated revenue from operations grew 8% YoY to ₹46,255 Crore in Q1 FY27.
Stable Bottom-Line Profit: Consolidated Net Profit (PAT) reached ₹8,850 Crore, up 0.7% YoY.
Strong e-Auction Demand: e-Auction volumes jumped 25% YoY to 26.52 MT, with realizations rising to ₹3,085.44/tonne.
Coal Offtake Surge: Total dispatch reached 197.86 Million Tonnes (+4% YoY), drawing down pithead stocks by 28.93 MT.
Clean Energy Milestone: Generated first commercial solar revenue (₹5.68 Cr) from its 100 MW Bhadramali plant.
Gasification Progress: Foundation stone laid for the ₹25,000 Cr BCGCL coal-to-ammonium-nitrate project.
Subsidiary Performance: Eastern Coalfields (ECL) doubled PBT to ₹517 Cr, while Mahanadi Coalfields (MCL) remained the top profit generator at ₹3,226 Cr.
Under Control Employee Costs: Employee expenses remained flat at ₹11,023 Cr (+0.4% YoY).
Conservative Leverage: Maintained a debt-to-equity ratio of 0.12x and an expanded Current Ratio of 1.90x.
Book Value Expansion: Book Value Per Share grew to ₹206.91.
Conclusion
Coal India Limited started FY27 on a solid financial footing. Top-line revenue reached ₹46,255 Crore, driven by higher e-Auction sales volumes and elevated price realizations. While production faced temporary operational constraints, coal offtake scaled to 197.86 Million Tonnes, supported by drawdowns in pithead stock.
With a debt-to-equity ratio of 0.12x, strong cash yields, initial revenue generation from solar projects, and progress on coal gasification, Coal India remains a core asset for income-focused equity portfolios seeking high dividend yields and exposure to India’s growing energy demand.



