

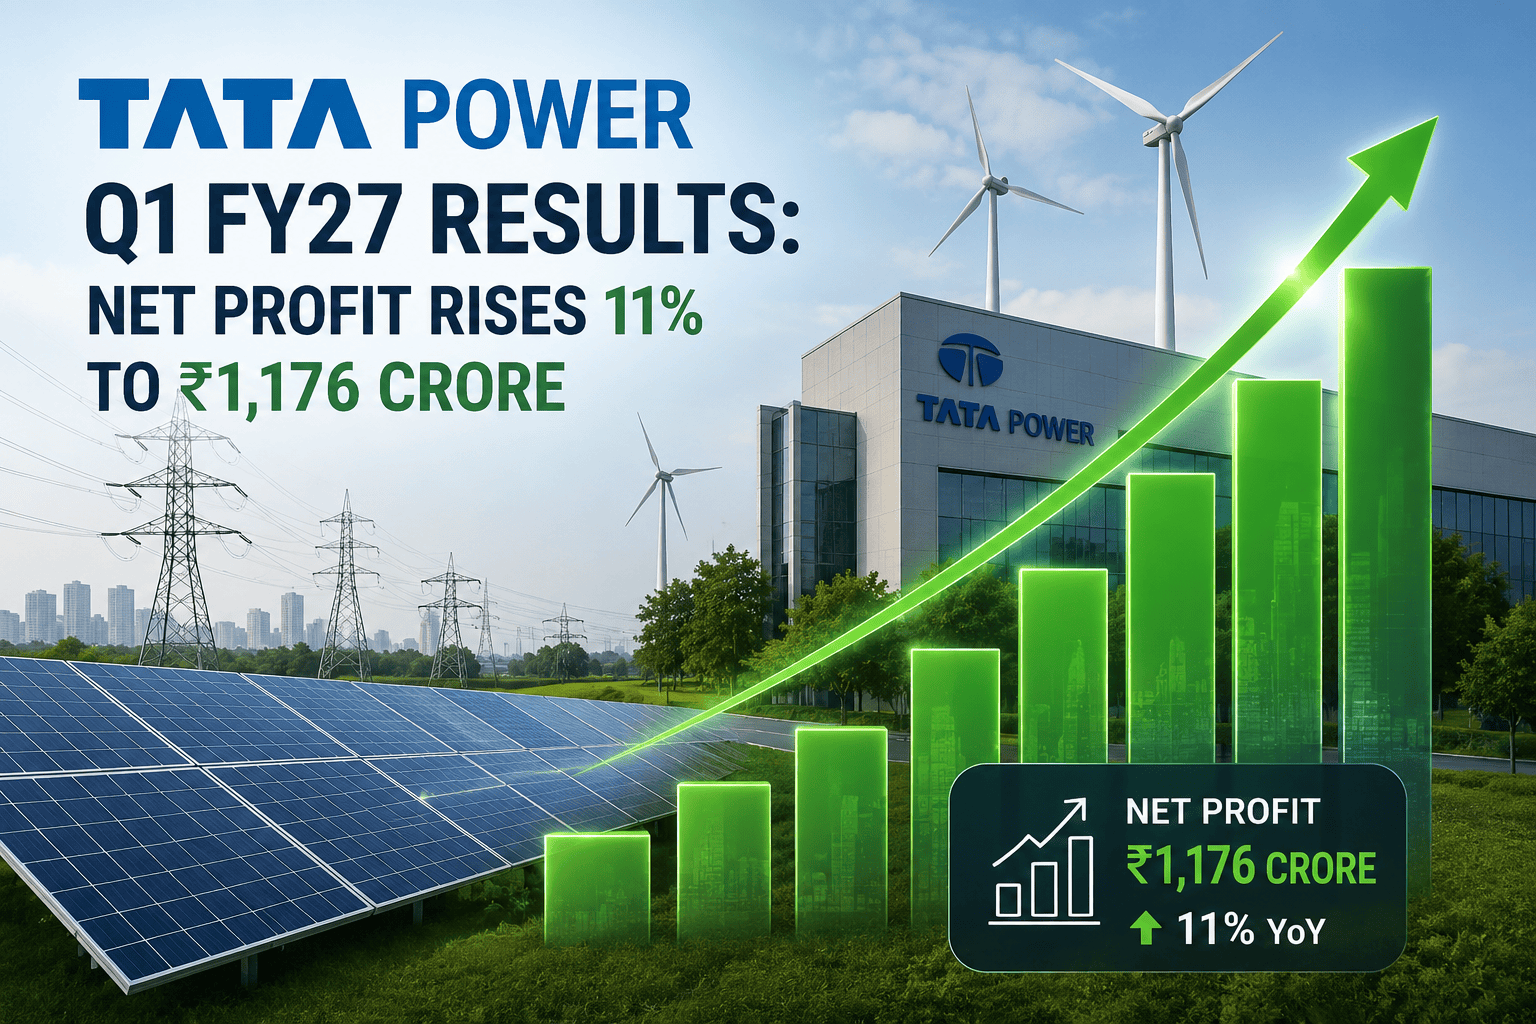
The Tata Power Company Limited released its unaudited consolidated and audited standalone financial results for the first quarter ended June 30, 2026 (Q1 FY27) on July 27, 2026. The power sector major delivered a steady financial performance characterized by top-line revenue expansion and bottom-line profit growth.
What Happened?
Consolidated Revenue from Operations for Q1 FY27 rose 5.63% Year-on-Year (YoY) to ₹19,051.26 crore, compared to ₹18,035.07 crore reported in the corresponding quarter of the previous fiscal year (Q1 FY26). On a sequential basis (QoQ), revenue from operations expanded 27.86% over the ₹14,900.20 crore recorded in Q4 FY26.
Consolidated Net Profit attributable to Owners of the Company expanded 10.95% YoY to ₹1,175.93 crore in Q1 FY27, up from ₹1,059.86 crore in Q1 FY26. Total Consolidated Net Profit for the Period (including non-controlling interests) stood at ₹1,400.86 crore, marking a 10.97% YoY increase from ₹1,262.32 crore in Q1 FY26.
+-----------------------------------------------------------------------------------+
|                     TATA POWER Q1 FY27 CONSOLIDATED HIGHLIGHTS                    |
+-----------------------------------------------------------------------------------+
|  • Revenue from Operations: ₹19,051.26 Crore  (+5.63% YoY | +27.86% QoQ)           |
|  • Net Profit (Owners):      ₹1,175.93 Crore  (+10.95% YoY | +18.08% QoQ)          |
|  • Total Net Profit (PAT):   ₹1,400.86 Crore  (+10.97% YoY | -1.04% QoQ)           |
|  • Total Income:             ₹19,439.65 Crore (+5.67% YoY | +25.78% QoQ)          |
|  • Basic EPS (post-reg):     ₹3.68 per share  (vs ₹3.31 YoY | vs ₹3.12 QoQ)        |
+-----------------------------------------------------------------------------------+
Why Is It Important?
The Q1 FY27 performance reflects operational stability across Tata Power’s integrated utility structure. The Transmission & Distribution (T&D) segment continued to be the largest contributor to top-line consolidated revenue, reporting gross segment revenue of ₹11,440.70 crore. Concurrently, the Thermal & Hydro segment experienced significant quarter-on-quarter recovery following operational adjustments under Section 11 directions and the Supplementary Power Purchase Agreement (SPPA) framework for the Mundra power plant.
Why Should Investors Care?
Tata Power’s balance sheet structure remains stable despite capital expenditure for its ongoing energy transition. Consolidated Net Worth stood at ₹43,555.43 crore as of June 30, 2026, compared to ₹42,153.39 crore as of March 31, 2026. The Debt-to-Equity ratio remained well-managed at 1.63x. Furthermore, the company successfully paid out its approved final dividend of ₹2.50 per share for FY26 on July 10, 2026, reinforcing capital return commitments to equity shareholders.
Quick Highlights
Consolidated Top-Line Expansion: Revenue from operations reached ₹19,051.26 crore in Q1 FY27, up 5.63% YoY from ₹18,035.07 crore.
Profitability Growth: Net Profit attributable to owners reached ₹1,175.93 crore (+10.95% YoY).
Sequential Recovery: Top-line revenue increased by 27.86% QoQ, driven by seasonal demand surges and higher power throughput.
T&D Strength: Transmission & Distribution segment revenue expanded to ₹11,440.70 crore in Q1 FY27 from ₹10,077.83 crore in Q1 FY26.
Thermal & Hydro Segment: Recorded segment revenue of ₹5,192.83 crore and segment results of ₹1,098.24 crore.
Renewables Performance: Gross renewables segment revenue stood at ₹3,771.46 crore, generating segment results of ₹1,210.40 crore.
Debt Metrics: Consolidated Debt-to-Equity ratio remained stable at 1.63x.
Interest Coverage: Interest Service Coverage Ratio was recorded at 2.38x.
Dividend Settlement: Final dividend for FY26 of ₹2.50 per equity share (aggregating ₹798.83 crore) was disbursed on July 10, 2026.
Complete Financial Snapshot Table
The following snapshot provides a comparison of key consolidated financial parameters for Q1 FY27 against Q4 FY26 and Q1 FY26.
All monetary figures in ₹ Crore unless specified otherwise
| Financial Parameter | Q1 FY27 (Unaudited) | Q4 FY26 (Audited) | Q1 FY26 (Unaudited) | YoY Growth (%) | QoQ Growth (%) |
| Revenue from Operations | 19,051.26 | 14,900.20 | 18,035.07 | +5.63% | +27.86% |
| Other Income | 388.39 | 555.28 | 361.71 | +7.38% | -30.05% |
| Total Income | 19,439.65 | 15,455.48 | 18,396.78 | +5.67% | +25.78% |
| Cost of Power Purchased | 6,164.23 | 5,260.81 | 4,675.37 | +31.84% | +17.17% |
| Cost of Fuel | 3,868.19 | 3,555.22 | 1,336.29 | +189.47% | +8.80% |
| Employee Benefits Expense | 1,184.83 | 1,295.26 | 1,161.36 | +2.02% | -8.53% |
| Finance Costs | 1,406.78 | 1,279.22 | 1,233.77 | +14.02% | +9.97% |
| Depreciation & Amortisation | 1,259.86 | 1,280.23 | 1,160.91 | +8.52% | -1.59% |
| Other Expenses | 1,730.80 | 2,214.50 | 1,615.73 | +7.12% | -21.84% |
| Total Expenses | 17,704.61 | 14,876.50 | 16,336.19 | +8.38% | +19.01% |
| Profit Before Regulatory Deferral & Tax | 1,735.04 | 2,060.59 | 578.98 | +199.67% | -15.80% |
| Movement in Regulatory Deferral (Net) | (153.09) | 1,061.72 | (570.76) | N/A | N/A |
| Share of Profit of Associates & JVs | 241.39 | 250.47 | 129.63 | +86.21% | -3.63% |
| Profit Before Tax (PBT) | 1,823.34 | 1,891.17 | 1,619.46 | +12.59% | -3.59% |
| Total Tax Expense | 422.48 | 381.48 | 357.14 | +18.30% | +10.75% |
| Net Profit for the Period (PAT) | 1,400.86 | 1,415.52 | 1,262.32 | +10.97% | -1.04% |
| PAT Attributable to Owners | 1,175.93 | 995.91 | 1,059.86 | +10.95% | +18.08% |
| Basic EPS (post-regulatory) (₹) | 3.68 | 3.12 | 3.31 | +11.18% | +17.95% |
| Paid-up Equity Capital (FV ₹1) | 319.56 | 319.56 | 319.56 | 0.00% | 0.00% |
| Net Worth | 43,555.43 | 42,153.39 | 39,102.77 | +11.39% | +3.33% |
| Debt Equity Ratio (times) | 1.63 | 1.62 | 1.49 | +14 bps | +1 bps |
| Interest Service Coverage Ratio (times) | 2.38 | 2.52 | 2.36 | +2 bps | -14 bps |
| Current Ratio (times) | 0.87 | 0.87 | 0.82 | +5 bps | 0 bps |
| Operating Margin (%) | 15% | 16% | 15% | 0 bps | -100 bps |
| Net Profit Margin (%) | 7% | 9% | 7% | 0 bps | -200 bps |
Detailed Business Performance by Segment
Tata Power operates an integrated business structure spanning power generation, transmission, distribution, and renewable energy assets.
+-----------------------------------------------------------------------------------+
|                        TATA POWER INTEGRATED BUSINESS UNITS                       |
+-----------------------------------------------------------------------------------+
                                          |
     +------------------------------------+------------------------------------+
     |                                                                         |
+----+-------------------------------+                    +--------------------+-------------------------------+
|     TRANSMISSION & DISTRIBUTION    |                    |             RENEWABLE ENERGY                  |
+------------------------------------+                    +----------------------------------------------------+
| • Odisha DISCOMs (TPCODL, etc.)    |                    | • Wind & Solar Generation Utility Portfolio        |
| • Delhi Distribution (TPDDL)       |                    | • TP Solar Manufacturing (Cell & Module)          |
| • Transmission Lines & Smart Grids |                    | • Solar EPC Services & Rooftop Installations      |
| • Power Trading (TPTCL)            |                    | • EV Charging Network Infrastructure              |
+------------------------------------+                    +----------------------------------------------------+
     |                                                                         |
     +------------------------------------+------------------------------------+
                                          |
                        +-----------------+-----------------+
                        |        THERMAL & HYDRO GENERATION |
                        +-----------------------------------+
                        | • Mundra Ultra Mega Power Plant   |
                        | • Maithon Power Limited (MPL)     |
                        | • Hydro Assets & Pumped Storage   |
                        | • Coal Mines JVs (PT Kaltim)      |
                        +-----------------------------------+
1. Transmission and Distribution (T&D)
The T&D business remains the primary revenue generator for Tata Power, consisting of distribution operations across Odisha (TPCODL, TPWODL, TPSODL, TPNODL), Delhi (TPDDL), Mumbai, Ajmer, alongside power transmission assets.
Segment Revenue: Gross T&D revenue reached ₹11,440.70 crore in Q1 FY27, representing a 13.52% YoY growth compared to ₹10,077.83 crore in Q1 FY26.
Segment Results: EBIT for the T&D segment came in at ₹774.99 crore, expanding from ₹721.29 crore in Q1 FY26.
Segment Assets & Liabilities: Total segment assets were recorded at ₹55,284.59 crore with segment liabilities at ₹31,764.72 crore as of June 30, 2026.
2. Renewables
The Renewables arm incorporates utility-scale solar and wind generation, rooftop solar solutions, solar cell/module manufacturing (TP Solar Limited), solar EPC services, and electric vehicle charging infrastructure.
Segment Revenue: Gross revenue stood at ₹3,771.46 crore in Q1 FY27, compared to ₹3,625.85 crore in Q1 FY26 and ₹4,003.43 crore in Q4 FY26.
Inter-Segment Eliminations: Inter-segment transfers (primarily solar EPC supplies to captive project development arms) totaled ₹351.80 crore during the quarter.
Segment Profitability: The Renewables business generated segment results of ₹1,210.40 crore in Q1 FY27, up 7.59% YoY from ₹1,125.00 crore in Q1 FY26.
Asset Allocation: Total capital deployed in the Renewables segment reached ₹59,381.69 crore as of June 30, 2026, representing the largest single asset pool on Tata Power’s balance sheet.
3. Thermal and Hydro Generation
This segment comprises thermal power assets (including the Mundra UMPP and Maithon Power Limited), hydro generating stations, pumped storage developments, and investments in international coal mining operations (such as PT Kaltim Prima Coal).
Gross Segment Revenue: Reached ₹5,192.83 crore in Q1 FY27, reflecting an 7.20% increase YoY compared to ₹4,844.19 crore in Q1 FY26, and a notable surge from ₹2,433.84 crore in Q4 FY26.
Segment Results: EBIT reached ₹1,098.24 crore in Q1 FY27, compared to ₹852.48 crore in Q1 FY26 and ₹474.83 crore in Q4 FY26.
Mundra Operations Update: The Ministry of Power extended Section 11 directions allowing Mundra plant operations under the terms of the Supplementary Power Purchase Agreement (SPPA) through September 30, 2026.
Operational Factors & Driver Analysis
                            +-----------------------------------+
                            |  REVENUE FROM OPERATIONS: +5.63%  |
                            +-----------------------------------+
                                              |
                                              v
+-----------------------------------------------------------------------------------+
|                        KEY OPERATIONAL COST DRIVERS (Q1 FY27)                     |
+-----------------------------------------------------------------------------------+
|  1. Cost of Fuel: Expanded to ₹3,868.19 Cr due to higher thermal dispatch          |
|  2. Power Purchase Costs: Increased to ₹6,164.23 Cr to meet peak seasonal load     |
|  3. Regulatory Adjustments: Net movement of (₹153.09 Cr) vs (₹570.76 Cr) in Q1 FY26|
|  4. Finance Costs: Up 14.02% YoY to ₹1,406.78 Cr on ongoing capital expenditure   |
+-----------------------------------------------------------------------------------+
                                              |
                                              v
                            +-----------------------------------+
                            |    NET PROFIT (OWNERS): +10.95%   |
                            +-----------------------------------+
Revenue & Profit Dynamics
Fuel Cost Volatility: Cost of fuel rose to ₹3,868.19 crore in Q1 FY27 compared to ₹1,336.29 crore in Q1 FY26, driven by higher generation volumes at thermal assets to meet summer peak power demand.
Power Purchase Costs: Power purchase expenses expanded by 31.84% YoY to ₹6,164.23 crore, reflecting higher power intake by distribution companies during peak summer loads.
Regulatory Deferral Balances: Net movement in regulatory deferral balances stood at (₹153.09) crore in Q1 FY27 compared to (₹570.76) crore in Q1 FY26. These accounting entries align tariff realizations with approved regulatory frameworks across regulated distribution zones.
Segment-Wise Financial Breakdown
Consolidated Segment Revenue & Results Table
Figures in ₹ Crore
| Segment | Revenue (Q1 FY27) | Revenue (Q4 FY26) | Revenue (Q1 FY26) | EBIT (Q1 FY27) | EBIT (Q4 FY26) | EBIT (Q1 FY26) |
| Thermal & Hydro | 5,192.83 | 2,433.84 | 4,844.19 | 1,098.24 | 474.83 | 852.48 |
| Renewables | 3,771.46 | 4,003.43 | 3,625.85 | 1,210.40 | 915.05 | 1,125.00 |
| Transmission & Distribution | 11,440.70 | 10,698.83 | 10,077.83 | 774.99 | 1,358.78 | 721.29 |
| Others | 106.44 | 114.68 | 109.05 | (76.68) | (36.37) | (29.68) |
| Less: Inter-Segment Revenue | (1,629.99) | (1,318.83) | (1,204.38) | — | — | — |
| Total Segment Financials | 18,881.44 | 15,931.95 | 17,452.54 | 3,006.95 | 2,712.29 | 2,669.09 |
Detailed Financial Ratio Analysis
The table below outlines key operational and coverage ratios disclosed under Regulation 52(4) of the SEBI Listing Obligations and Disclosure Requirements (LODR):
Consolidated Financial Ratios Table
| Ratio Metric | Q1 FY27 | Q4 FY26 | Q1 FY26 | Disclosed Formula Reference PDF |
| Debt Equity Ratio | 1.63x | 1.62x | 1.49x | Total Debt / Total Equity |
| Debt Service Coverage Ratio (DSCR) | 1.74x | 2.09x | 1.60x | (PBT + Interest + Depr – Current Tax) / (Interest + Scheduled Principal Repayments) |
| Interest Service Coverage Ratio (ISCR) | 2.38x | 2.52x | 2.36x | (PBT + Interest) / Interest Expense |
| Current Ratio | 0.87x | 0.87x | 0.82x | Current Assets / Current Liabilities |
| Long Term Debt to Working Capital | 26.56x | 37.86x | 23.97x | Long-Term Debt / Working Capital |
| Debtors Turnover (Days) | 72 Days | 86 Days | 67 Days | Average Trade Receivables x Days / Revenue |
| Inventory Turnover (Days) | 71 Days | 113 Days | 55 Days | Average Inventories x Days / Cost of Goods Sold |
| Operating Margin (%) | 15% | 16% | 15% | Operating Profit / Total Segment Revenue |
| Net Profit Margin (%) | 7% | 9% | 7% | PAT / Total Segment Revenue |
Peer Comparison Table
A comparison of Tata Power against major Indian power sector utilities highlights relative operational scale and market valuation:
| Company Name | Revenue (Q1 FY27 Est / TTM) | Net Profit (TTM) | Market Cap (Approx ₹ Cr) | P/E Ratio | Debt Equity Ratio | Business Focus |
| Tata Power | ₹19,051 Cr (Q1) | ~₹5,250 Cr | ~₹1,35,000 Cr | ~32.5x | 1.63x | Integrated Utility & Green Energy |
| NTPC Limited | ~₹45,000 Cr (Q1) | ~₹21,000 Cr | ~₹3,80,000 Cr | ~18.2x | 1.45x | Thermal Generation Leader |
| Adani Power | ~₹15,000 Cr (Q1) | ~₹18,000 Cr | ~₹2,60,000 Cr | ~15.1x | 0.85x | Thermal Generation Focus |
| Torrent Power | ~₹7,200 Cr (Q1) | ~₹2,100 Cr | ~₹72,000 Cr | ~34.0x | 0.92x | Urban Distribution & Thermal |
| JSW Energy | ~₹3,800 Cr (Q1) | ~₹1,800 Cr | ~₹1,20,000 Cr | ~65.0x | 1.35x | Renewable Expansion & Hydro |
| NHPC Limited | ~₹3,100 Cr (Q1) | ~₹4,200 Cr | ~₹1,00,000 Cr | ~24.0x | 0.80x | Pure-Play Hydro Generation |
Share Price Analysis & Legal Matters
+-----------------------------------------------------------------------------------+
|                        TATA POWER SHARE & MARKET DATA SNAPSHOT                    |
+-----------------------------------------------------------------------------------+
|  • Market Capitalisation:   ~₹1,35,000 Crore                                      |
|  • 52-Week Range:           ₹325.00 – ₹485.00                                     |
|  • Promoter Holding:        46.86% (Held primarily by Tata Sons)                  |
|  • FII Holding:             ~9.80%                                                |
|  • DII Holding:             ~16.20%                                               |
|  • Public & Individual:     ~27.14%                                               |
+-----------------------------------------------------------------------------------+
Litigation Disclosure: Kleros Arbitration Award
In Note 4 of the consolidated financial statements, Tata Power disclosed details regarding an arbitration award published by the Singapore International Arbitration Centre (SIAC).
Award Details: The tribunal directed Tata Power to pay Kleros Capital Partners Limited USD 490.32 million plus interest (5.33% from Nov 30, 2020) and SGD 11.34 million in legal costs.
Company Stance: Based on advice from external legal counsel, Tata Power filed an appeal on October 23, 2025, with the Singapore International Commercial Court (SICC) to set aside the award.
Accounting Treatment: Hearings have concluded and the judgment remains reserved. Consequently, no financial provision has been recorded in the Q1 FY27 results.
SWOT Analysis
+-----------------------------------------------------------------------------------+
|                                 SWOT ANALYSIS                                     |
+-----------------------------------------------------------------------------------+
|  STRENGTHS                                 |  WEAKNESSES                          |
|  • Fully integrated value chain            |  • High debt levels (1.63x D/E)      |
|  • Strong Tata Group backing & brand       |  • Regulatory dependency in DISCOMs  |
|  • Large renewable project pipeline        |  • Ongoing litigation (Kleros SIAC)  |
|                                            |                                      |
|  OPPORTUNITIES                             |  THREATS                             |
|  • National EV charging expansion          |  • Fluctuations in imported coal     |
|  • Rooftop solar adoption (PM Surya Ghar)  |  • Execution delays in renewables    |
|  • Smart metering deployment across DISCOMs|  • Tariff caps set by state boards   |
+-----------------------------------------------------------------------------------+
Strengths
Integrated Business Model: Operations span thermal generation, hydro assets, distribution networks, transmission corridors, solar manufacturing, and EV charging infrastructure.
Capital Discipline: Maintains interest coverage of 2.38x despite ongoing capex programs.
Weaknesses
Debt Load: Consolidated leverage of 1.63x requires continuous cash flow generation to service borrowing obligations.
Opportunities
Energy Transition: Capitalizing on government clean energy mandates through TP Solar’s cell and module manufacturing capacity.
Threats
Fuel Cost Exposure: Volatility in global coal markets directly impacts thermal generation economics.
Investor Suitability Matrix
| Investor Category | Suitability Assessment | Primary Analytical Rationale |
| Long-Term Investors | Highly Suitable | Beneficiary of India’s long-term energy transition and grid modernization programs. |
| Growth Investors | Suitable | Backed by expanding renewable capacity, solar manufacturing, and EV infrastructure. |
| Dividend Investors | Moderately Suitable | Delivers regular dividend payments (₹2.50 per share for FY26), yielding ~0.6%. |
| Value Investors | Neutral | Valuations (~32.5x P/E) reflect growth expectations across clean energy segments. |
| Short-Term Traders | Tactical | Price movements react to quarterly earnings, seasonal power demand, and regulatory updates. |
Key Takeaways
Top-Line Growth: Consolidated Revenue from Operations expanded 5.63% YoY to ₹19,051.26 crore in Q1 FY27.
Profit Growth: Net profit attributable to owners reached ₹1,175.93 crore (+10.95% YoY).
Sequential Momentum: Revenue expanded 27.86% QoQ due to seasonal power consumption peaks.
T&D Dominance: Transmission & Distribution gross revenue grew to ₹11,440.70 crore.
Renewables Contribution: Renewables EBIT expanded to ₹1,210.40 crore.
Mundra SPPA Extension: Section 11 directions permit Mundra plant operations under the SPPA framework through September 30, 2026.
Stable Leverage: Consolidated Debt-to-Equity ratio remained stable at 1.63x.
Net Worth Growth: Total Consolidated Net Worth rose to ₹43,555.43 crore.
Coverage Ratios: Interest Service Coverage Ratio stood at 2.38x.
Dividend Paid: Final dividend of ₹2.50 per equity share for FY26 was disbursed on July 10, 2026.
Conclusion
The Tata Power Company Ltd. started FY27 with a steady operational performance. Top-line consolidated revenue reached ₹19,051.26 crore, while net profit attributable to owners reached ₹1,175.93 crore. Driven by steady growth in Transmission & Distribution and sustained contributions from Renewables, Tata Power continues to maintain balance sheet stability during its ongoing capital expansion program.



