

Introduction
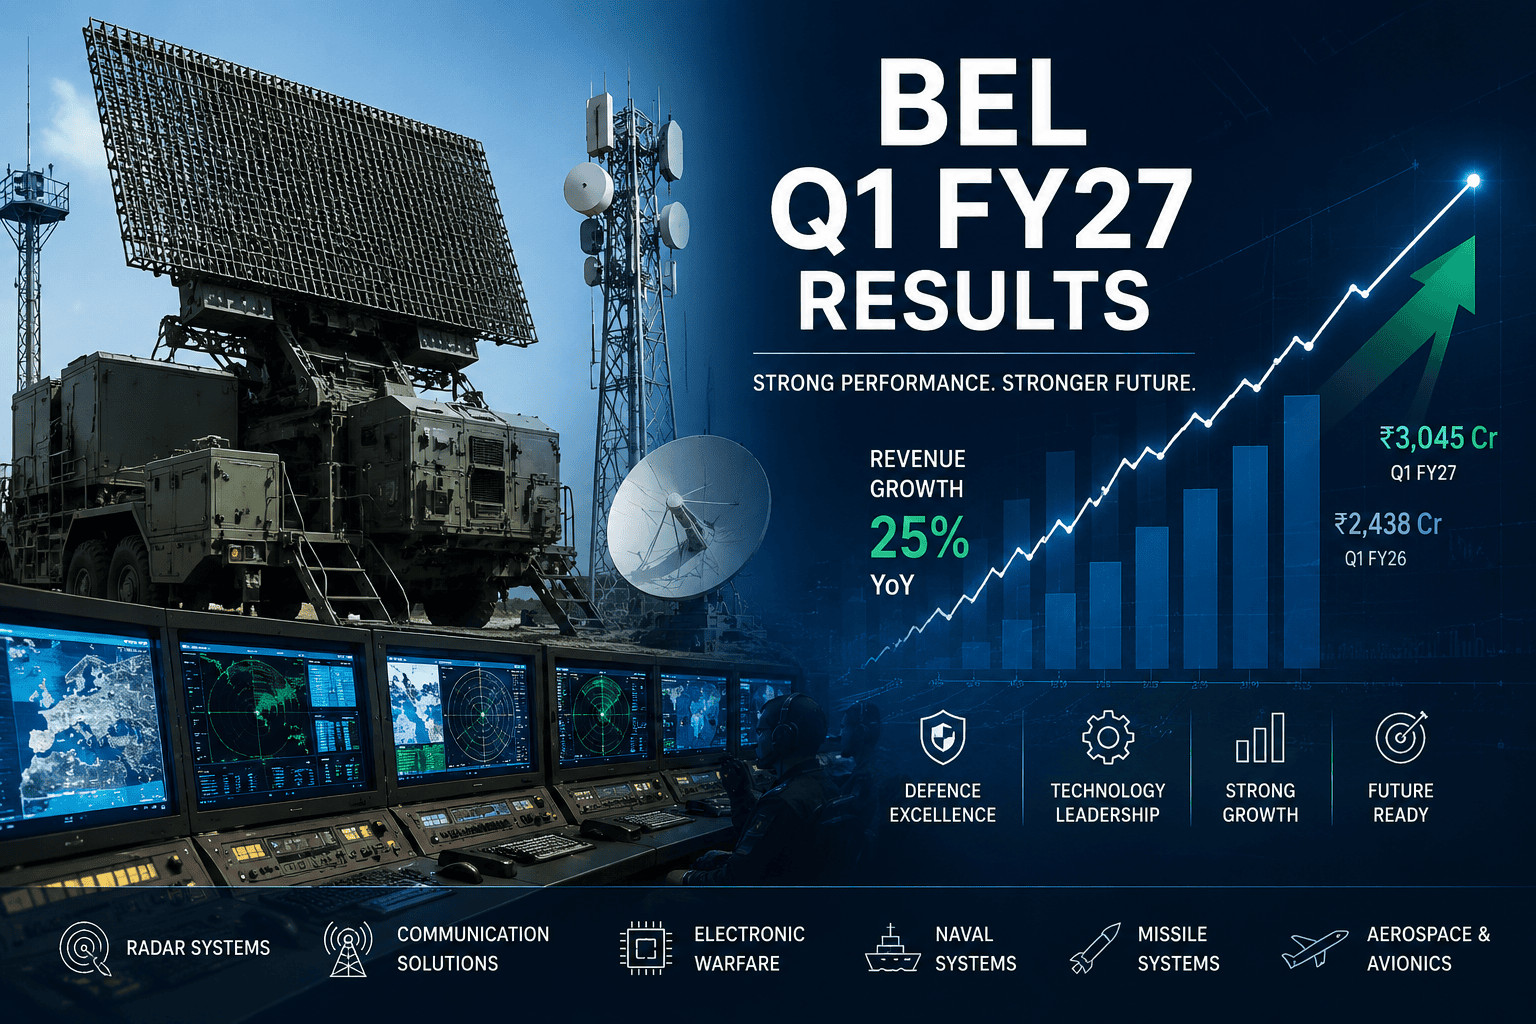
Bharat Electronics Limited (BEL), India’s flagship Navratna defence public sector undertaking (PSU), released its financial results for the first quarter of Financial Year 2026-27 (Q1 FY27) on July 27, 2026. The quarterly performance of BEL is widely watched across Indian equity markets. As the dominant provider of electronic systems to the Indian Armed Forces, BEL acts as a barometer for the broader Indian defence manufacturing ecosystem and the government’s push toward strategic self-reliance (Atmanirbhar Bharat).
Investors and institutional analysts closely evaluate BEL’s quarterly performance due to its central position in executing the Ministry of Defence’s (MoD) capital procurement plans. Over the past several years, India’s defence budget allocation toward domestic capital procurement has increased substantially, creating sustained operational momentum for indigenous equipment manufacturers. BEL sits at the technology intersection of radar systems, missile electronics, electronic warfare suites, tactical communications, and naval weapons control, giving it high visibility into military modernization cycles.
The Q1 FY27 results offer critical insights into how effectively BEL is translating its expanding backlog into operational revenues, navigating international supply chain dynamics, and expanding its export footprint. Beyond the domestic military domain, global institutional investors track BEL to evaluate India’s emergence as an exporter of defense electronics into friendly nations across South Asia, Southeast Asia, Africa, and the Middle East.
Company Overview
Established in 1954 under the Ministry of Defence to meet the specialized electronic requirements of the Indian Armed Forces, Bharat Electronics Limited has evolved from a basic component manufacturer into a premier defence electronics enterprise. Operating under the strategic oversight of the MoD, BEL maintains an indigenisation level of around 70-80% across its core product categories, supported by close research partnerships with the Defence Research and Development Organisation (DRDO).
Business Model & Product Portfolio
BEL operates primarily across nine state-of-the-art manufacturing units located across India (including Bengaluru, Ghaziabad, Hyderabad, Chennai, Machilipatnam, Pune, Kotdwara, Navi Mumbai, and Panchkula). Its core revenue is derived from turnkey defence projects, equipment supply, long-term spares support, and system integration contracts across land, air, and sea applications.
+-----------------------------------------------------------------------------------+
|                            BHARAT ELECTRONICS LIMITED                             |
+-----------------------------------------------------------------------------------+
                                         |
     +-----------------------------------+-----------------------------------+
     |                                                                       |
+----+------------------------------+                   +--------------------+------------------------------+
|       DEFENCE ELECTRONICS         |                   |           NON-DEFENCE / CIVILIAN                 |
+-----------------------------------+                   +---------------------------------------------------+
| • Radar & Fire Control Systems    |                   | • Electronic Voting Machines (EVM/VVPAT)          |
| • Missile System Electronics      |                   | • Smart City Systems & Cybersecurity              |
| • Electronic Warfare (EW) Suites  |                   | • Solar Power & Renewable Energy                  |
| • Naval Weapons & Sonars          |                   | • Healthcare & Medical Electronics            |
| • Tactical Communications         |                   | • Air Traffic Control (ATC) Systems               |
| • Avionics & Electro-Optics       |                   | • Artificial Intelligence Solutions               |
+-----------------------------------+                   +---------------------------------------------------+
Defence Electronics: The bedrock of BEL’s operations, contributing over 80-85% of total revenues. Key sub-segments include high-power surveillance radars, missile guidance electronics (such as Akash and QRSAM), integrated electronic warfare suites for fighter aircraft and surface ships, naval combat management systems, and advanced software-defined radios.
Civilian & Dual-Use Business: Diversified segments designed to balance defence cyclicality. Includes Electronic Voting Machines (EVMs), Voter Verifiable Paper Audit Trail (VVPAT) devices, smart city surveillance architecture, air traffic management electronics, solar power systems, and specialized medical instrumentation.
Emerging Technologies: Active development in Artificial Intelligence (AI) for predictive combat management, cybersecurity solutions for critical infrastructure, space-grade electronics for satellites, and microelectronics manufacturing through domestic joint ventures.
Q1 FY27 Result Highlights
In its official filing to the stock exchanges (NSE and BSE) on July 27, 2026, Bharat Electronics Ltd. presented its unaudited standalone and consolidated financial results for the quarter ended June 30, 2026 (Q1 FY27). The Board of Directors also approved a proposal to increase the company’s Authorised Share Capital from ₹750 crore to ₹1,000 crore, subject to shareholder approval at the upcoming Annual General Meeting (AGM).
+-----------------------------------------------------------------------------------+
|                        BEL Q1 FY27 KEY FINANCIAL SUMMARY                          |
+-----------------------------------------------------------------------------------+
|  • Standalone Revenue from Operations: ₹5,533.06 Cr   (+25.27% YoY)                |
|  • Standalone Profit Before Tax (PBT): ₹1,402.83 Cr   (+8.81% YoY)                 |
|  • Standalone Profit After Tax (PAT):  ₹1,048.33 Cr   (+8.17% YoY)                 |
|  • Total Order Book Position:          ₹72,258.00 Cr   (as of July 1, 2026)        |
+-----------------------------------------------------------------------------------+
Below is the standalone and consolidated financial performance table for Q1 FY27:
Standalone & Consolidated Unaudited Financial Summary (Q1 FY27)
All monetary figures in ₹ Lakhs unless specified otherwise
| Particulars | Q1 FY27 Standalone | Q1 FY27 Consolidated |
| Revenue from Operations | 5,53,306 | 5,54,698 |
| Other Income | 16,739 | 16,956 |
| Total Income | 5,70,045 | 5,71,654 |
| Cost of Materials Consumed | 3,03,588 | 3,04,123 |
| Consumption of Stock-in-Trade | 27,981 | 27,981 |
| Changes in Inventories (FG, WIP, Scrap) | (29,993) | (30,007) |
| Employee Benefits Expense | 78,644 | 79,284 |
| Finance Costs | 116 | 116 |
| Depreciation & Amortisation | 15,260 | 16,055 |
| Other Expenses | 34,166 | 34,477 |
| Total Expenses | 4,29,762 | 4,32,029 |
| Profit Before Tax (PBT) | 1,40,283 | 1,39,625 |
| Tax Expense (Current + Deferred) | 35,450 | 35,235 |
| Profit After Tax (PAT) | 1,04,833 | 1,05,453 |
| Basic & Diluted EPS (₹) (Not Annualised) | 1.43 | 1.44 |
| Paid-up Equity Share Capital (Face Value ₹1) | 73,098 | 73,098 |
Year-on-Year Comparison Table
Comparing Q1 FY27 performance against the corresponding quarter of the previous fiscal year (Q1 FY26) highlights solid top-line revenue momentum across primary execution lines.
YoY Performance Comparison (Standalone & Consolidated)
Figures in ₹ Lakhs / Percentage
| Metric | Q1 FY27 (Standalone) | Q1 FY26 (Standalone) | YoY Growth (%) | Q1 FY27 (Consolidated) | Q1 FY26 (Consolidated) | YoY Growth (%) |
| Revenue from Operations | 5,53,306 | 4,41,683 | +25.27% | 5,54,698 | 4,43,974 | +24.94% |
| Other Income | 16,739 | 16,362 | +2.30% | 16,956 | 16,332 | +3.82% |
| Total Income | 5,70,045 | 4,58,045 | +24.45% | 5,71,654 | 4,60,306 | +24.19% |
| Cost of Materials & Inventory | 3,01,576 | 2,06,511 | +46.03% | 3,02,097 | 2,07,608 | +45.51% |
| Employee Cost | 78,644 | 69,019 | +13.95% | 79,284 | 69,648 | +13.84% |
| Other Expenses | 34,166 | 42,159 | -18.96% | 34,477 | 42,891 | -19.62% |
| EBITDA (Calculated) | 1,55,659 | 1,40,356 | +10.90% | 1,55,796 | 1,40,159 | +11.16% |
| EBITDA Margin (%) | 28.13% | 31.78% | -365 bps | 28.09% | 31.57% | -348 bps |
| Profit Before Tax (PBT) | 1,40,283 | 1,28,924 | +8.81% | 1,39,625 | 1,27,936 | +9.14% |
| Profit After Tax (PAT) | 1,04,833 | 96,913 | +8.17% | 1,05,453 | 96,905 | +8.82% |
| Earnings Per Share (₹) | 1.43 | 1.33 | +7.52% | 1.44 | 1.33 | +8.27% |
| Order Book Position | ₹72,258 Cr | ₹76,705 Cr | -5.80% | ₹72,258 Cr | ₹76,705 Cr | -5.80% |
Quarter-on-Quarter Comparison
Evaluating quarterly defence manufacturing results requires accounting for intense seasonality. The fourth quarter (Q4) of Indian defence PSUs historically accounts for a disproportionately high share of annual execution and billing as project milestones are completed prior to the fiscal year-end.
Sequential Performance (Q4 FY26 vs Q1 FY27 – Standalone)
Figures in ₹ Lakhs
| Metric | Q1 FY27 (Unaudited) | Q4 FY26 (Balancing/Audited) | QoQ Change (%) |
| Revenue from Operations | 5,53,306 | 10,17,717 | -45.63% |
| Other Income | 16,739 | 10,815 | +54.78% |
| Total Expenses | 4,29,762 | 7,38,150 | -41.78% |
| Profit Before Tax (PBT) | 1,40,283 | 2,90,382 | -51.69% |
| Profit After Tax (PAT) | 1,04,833 | 2,20,316 | -52.42% |
| EPS (₹) | 1.43 | 3.01 | -52.49% |
The sequential contraction in top-line and bottom-line parameters is standard for BEL. Project commissioning, trial completions, and final MoD acceptances peak in Q4, leading to elevated billing during March, followed by normal operational resetting in Q1.
Financial Ratio Analysis
A closer inspection of key operational and financial ratios provides a clearer picture of BEL’s underlying balance sheet strength and cost structure during Q1 FY27.
Key Operational Ratios
+-----------------------------------------------------------------------------------+
|                        BEL Q1 FY27 MARGIN PROFILE & RATIOS                        |
+-----------------------------------------------------------------------------------+
|  • EBITDA Margin (Standalone):     28.13%  (vs. 31.78% in Q1 FY26)               |
|  • Net Profit Margin (PAT Margin):  18.95%  (vs. 21.94% in Q1 FY26)               |
|  • Effective Tax Rate:             25.27%  (vs. 24.83% in Q1 FY26)               |
|  • Debt-to-Equity Ratio:           0.00x   (Virtually Zero Debt)                  |
+-----------------------------------------------------------------------------------+
EBITDA Margin: Standalone EBITDA margin moderated by 365 bps YoY to 28.13% in Q1 FY27 (compared to 31.78% in Q1 FY26). This shift was primarily driven by higher raw material consumption and imported component utilization during the execution of specific radar and communication contracts during the quarter.
Net Profit Margin: Net margin settled at 18.95% in Q1 FY27 compared to 21.94% in Q1 FY26, reflecting the expansion in raw material costs relative to operating revenue growth.
Debt-to-Equity Ratio: BEL continues to operate as a net-debt-free business. Finance costs for the quarter remained negligible at ₹116 Lakhs.
Return Metrics (ROE & ROCE): On an annualised trailing basis, BEL maintains high return metrics, with ROCE exceeding 30% and ROE remaining around 25%, supported by efficient working capital utilization and zero long-term debt liabilities.
Segment Analysis
In accordance with Ministry of Corporate Affairs Notification G.S.R. No. 463(E), companies engaged in defence production are exempted from segment reporting requirements. Consequently, BEL does not report separate financial breakdowns for individual sub-segments in its stock exchange filings.
However, operational highlights and management disclosures reflect clear performance trends across key categories:
1. Defence Electronics Segment
Radars & Surveillance: Key revenue driver for Q1 FY27, backed by ongoing deliveries of Air Defence Fire Control Radars, Mountain Radars, and Weapon Locating Radars.
Missile Systems: Steady progress on electronic command packages and guidance units for Akash Air Defence Systems and Medium-Range Surface-to-Air Missile (MRSAM) programs.
Naval Electronics: Integration of sonar equipment, electronic support measures (ESM), and combat management architectures across surface warships currently under construction at domestic shipyards.
Tactical Communications: Execution of Software Defined Radios (SDR) and encrypted communication networks for the Indian Army and Indian Air Force.
2. Civilian & Non-Defence Segment
EVM/VVPAT Manufacturing: Routine upkeep and supply contracts associated with state assembly elections and local civic body requirements.
Smart Cities & Healthcare: Ongoing execution of command and control center software projects for smart cities along with specialized healthcare equipment assemblies.
Order Book Analysis
The health of BEL’s order book remains one of its primary investment highlights, offering clear multi-year revenue visibility.
+-----------------------------------------------------------------------------------+
|                        BEL ORDER BOOK COVERAGE & PIPELINE                         |
+-----------------------------------------------------------------------------------+
|  • Total Order Book Position:       ₹72,258 Crore (as of July 1, 2026)            |
|  • Fresh Orders Secured in Q1 FY27:  >₹3,400 Crore                                |
|  • Major Q1 Wins:                   Mountain Radars (₹1,950 Cr)                   |
|                                     Ground Mobile Electronics (₹1,476 Cr)         |
|  • Revenue Visibility Coverage:     ~2.6x FY26 Revenue                            |
+-----------------------------------------------------------------------------------+
Current Order Backlog
As of July 1, 2026, BEL’s total order book position stood at ₹72,258 Crore. While this represents a slight reduction compared to the ₹73,882 Crore reported at the beginning of the fiscal year (April 1, 2026) due to strong Q1 execution, fresh order inflows remained robust throughout the quarter.
Key Fresh Order Inflows
During Q1 FY27, BEL secured several significant contracts, including:
Mountain Radars Contract: Valued at approximately ₹1,950 Crore for deployment across high-altitude border areas.
Ground-Based Mobile Electronic Systems: Contract worth ₹1,476 Crore.
Subsequent Summer Inflows: Additional orders totaling over ₹1,653 Crore secured in June and July 2026 for naval electronics, radar spares, and communication systems upgrades.
The current order backlog provides revenue visibility of approximately 2.6 times BEL’s full-year FY26 top-line revenue, protecting earnings against short-term macro uncertainty.
Management Commentary & Outlook
During the earnings call and executive disclosures following the release of the Q1 FY27 results, BEL management highlighted key strategic directions:
Top-Line Growth Target: Management reiterated its annual revenue growth guidance of 15–18% for FY27, supported by structured execution schedules across major defence programs.
Margin Guidance: The company targets maintaining an EBITDA margin floor of 25–27% for the full year FY27, despite temporary cost variations in specific quarters due to imported raw materials.
Annual Order Inflow Targets: Management expressed confidence in achieving its target for fresh order intakes exceeding ₹25,000–₹30,000 Crore during FY27, supported by upcoming big-ticket MoD tenders.
Capital Allocation & Expansion: The Board’s proposal to raise the Authorised Share Capital from ₹750 Crore to ₹1,000 Crore reflects preparations for future balance sheet requirements, expanding operational capacity, and ongoing R&D projects.
Why Did Profits Change?
While BEL registered a 25.27% increase in standalone operational revenue (reaching ₹5,533.06 Crore), standalone Profit After Tax (PAT) grew at a more moderate rate of 8.17% (reaching ₹1,048.33 Crore).
                            +---------------------------------+
                            |  REVENUE GROWTH: +25.27% YoY    |
                            +---------------------------------+
                                            |
                                            v
+-----------------------------------------------------------------------------------+
|                        FACTORS INFLUENCING PROFIT MARGINS                         |
+-----------------------------------------------------------------------------------+
|  1. Material Consumption: Raw material costs rose 46% YoY to ₹3,015.76 Cr         |
|  2. Order Mix: Higher proportion of imported components in Q1 radar deliveries     |
|  3. Operating Expenses: Other expenses declined 18.96% YoY, partially offsetting  |
|     material cost expansion                                                       |
|  4. Currency Volatility: Foreign exchange movements impacted component imports   |
+-----------------------------------------------------------------------------------+
                                            |
                                            v
                            +---------------------------------+
                            |    PAT GROWTH: +8.17% YoY       |
                            +---------------------------------+
Key Drivers of Profitability Dynamics:
Raw Material Cost Expansion: Total material costs (consumption of materials, stock-in-trade, and inventory changes) increased to ₹3,015.76 Crore in Q1 FY27 compared to ₹2,065.11 Crore in Q1 FY26 (up 46.03% YoY). This expansion outpaced top-line revenue growth.
Contract Execution Mix: Specific major system integration projects delivered in Q1 FY27 required a higher mix of imported specialized components, temporarily compressing gross margins relative to quarters dominated by high-margin software and domestic subsystems.
Operational Overhead Control: Overhead costs were well-managed; employee benefit expenses grew by a modest 13.95% to ₹786.44 Crore, while “Other Expenses” dropped 18.96% YoY to ₹341.66 Crore, mitigating input cost pressure.
Stable Other Income: Other income provided consistent support at ₹167.39 Crore, backed by cash reserves and interest yields.
Cash Flow & Balance Sheet Analysis
BEL maintains a rock-solid, net-debt-free balance sheet with healthy liquidity, allowing it to self-fund capital expenditures and R&D activities.
Balance Sheet & Liquidity Highlights
Zero Debt Balance: The company has no long-term borrowings, maintaining interest obligations at nominal levels (₹1.16 Crore in Q1 FY27).
Working Capital Dynamics: As is typical for major defence contractors, working capital requirements fluctuate in Q1 due to inventory build-up for ongoing execution and delayed customer advances early in the fiscal year.
Cash & Reserves Position: BEL holds robust cash and bank balances invested in short-term bank deposits and liquid instruments, generating steady treasury returns.
Dividend Delivery: The Board previously recommended a final dividend of 55% (₹0.55 per share) for FY26 in May 2026 (in addition to an interim dividend of 195% or ₹1.95 per share), reaffirming its commitment to regular cash payouts for shareholders.
Share Price Analysis & Market Reaction
On the result date (July 27, 2026), BEL shares traded around ₹406.70 on the National Stock Exchange (NSE), up approximately 0.42% from the previous close of ₹405.00.
+-----------------------------------------------------------------------------------+
|                        BEL STOCK TRADING RANGE (JULY 27, 2026)                    |
+-----------------------------------------------------------------------------------+
|  • Previous Close:  ₹405.00                                                       |
|  • Opening Price:   ₹408.00                                                       |
|  • Intraday High:   ₹408.45                                                       |
|  • Intraday Low:    ₹404.60                                                       |
|  • Last Traded Price: ₹406.70 (+0.42%)                                            |
|  • 52-Week Range:   ₹361.20 – ₹473.45                                             |
+-----------------------------------------------------------------------------------+
Technical & Valuation Indicators
Moving Averages: The stock trades close to its key short-term and long-term moving averages, with its 20-day, 50-day, and 200-day Simple Moving Averages consolidating around the ₹405.00–₹406.00 range.
Relative Strength Index (RSI): 14-day RSI stands neutral at 44.15, indicating stable trading conditions without overbought or oversold extremes.
Valuation Multiples: At current price levels, BEL trades at a Trailing Twelve Month (TTM) Price-to-Earnings (P/E) multiple of approximately 49.0x, reflecting market expectations for sustained double-digit growth in defence capital procurement.
Analyst View & Institutional Consensus
Institutional sell-side equity analysts maintain a generally positive outlook on BEL, supported by its strong market position, solid execution record, and high order book coverage.
+-----------------------------------------------------------------------------------+
|                        BROKERAGE CONSENSUS & RATING PROFILE                       |
+-----------------------------------------------------------------------------------+
|  • Buy Rating:        ~85% of covering analysts                                    |
|  • Hold Rating:       ~11% of covering analysts                                    |
|  • Sell Rating:       ~4% of covering analysts                                     |
|  • Consensus Target:  ₹460.00 – ₹490.00 per share                                  |
+-----------------------------------------------------------------------------------+
Bull Case vs. Bear Case
The Bull Case:
Dominant market share (>60%) in domestic defence electronics.
High revenue visibility backed by a ₹72,258 Crore order backlog.
Strong tailwinds from government indigenization targets and rising export demand.
Consistent cash generation, net-debt-free balance sheet, and reliable dividend yield.
The Bear Case:
Valuation multiples (~49x P/E) leave little room for operational delays.
Short-term gross margin volatility due to fluctuating component import costs.
Single-client concentration risk, with the Indian Ministry of Defence accounting for the vast majority of revenue.
Defence Industry Outlook
The Indian defence manufacturing sector continues to experience sustained growth, driven by key government policy initiatives:
+-----------------------------------------------------------------------------------+
|                       DEFENCE SECTOR GROWTH DRIVERS                               |
+-----------------------------------------------------------------------------------+
|  • Capital Budget Allocation: Over 75% reserved for domestic procurement          |
|  • Positive Indigenisation Lists: 5,000+ items restricted from direct import      |
|  • Export Target: Goal of reaching ₹50,000 Crore in national defence exports      |
|  • Modernisation Needs: High demand for sensors, AI, EW, and unmanned systems    |
+-----------------------------------------------------------------------------------+
Positive Indigenisation Lists (PIL): The MoD has progressively introduced lists banning the direct import of thousands of defence systems and sub-components, reserving these opportunities for domestic manufacturers like BEL.
Export Push: India has set an ambitious target to reach ₹50,000 Crore in annual defence exports by 2029. BEL is actively bidding for global tenders covering coastal surveillance systems, air defence radars, and tactical radios across friendly nations.
Technology Integration: Modern warfare relies heavily on electronics, network-centric communication, unmanned systems, and electronic warfare suites—directly matching BEL’s primary engineering strengths.
Global Peer Comparison
To contextualize BEL’s valuation and operating metrics, the table below compares it against domestic peers and international defence prime contractors:
Global & Domestic Defence Sector Comparison
| Company Name | Country | Primary Focus | P/E Ratio (TTM approx.) | ROE (%) | Order Backlog Visibility |
| Bharat Electronics (BEL) | India | Defence Electronics & Radars | ~49.0x | ~25% | ~2.6x Annual Revenue |
| Hindustan Aeronautics (HAL) | India | Aircraft & Helicopters | ~38.0x | ~28% | ~3.5x Annual Revenue |
| Bharat Dynamics (BDL) | India | Missile Systems & Munitions | ~65.0x | ~18% | ~3.0x Annual Revenue |
| Lockheed Martin | USA | Aerospace & Defence | ~19.5x | ~35% | ~2.5x Annual Revenue |
| RTX Corporation | USA | Missiles, Aviation & Sensors | ~28.0x | ~12% | ~2.2x Annual Revenue |
| Thales Group | France | Defence Electronics & Aerospace | ~22.0x | ~16% | ~2.4x Annual Revenue |
Domestic defence PSUs trade at higher P/E multiples than global peers, reflecting faster domestic budget spending growth and longer earnings visibility driven by India’s indigenisation program.
SWOT Analysis
+-----------------------------------------------------------------------------------+
|                                 SWOT ANALYSIS                                     |
+-----------------------------------------------------------------------------------+
|  STRENGTHS                                 |  WEAKNESSES                          |
|  • Near-monopoly in defence electronics    |  • High client concentration (MoD)   |
|  • Strong balance sheet & debt-free status |  • Import dependence for components  |
|  • Multidecadal DRDO tie-ups               |  • Seasonal execution patterns       |
|                                            |                                      |
|  OPPORTUNITIES                             |  THREATS                             |
|  • Expanding defence export market        |  • Increased private sector competition|
|  • AI, cybersecurity, and space electronics|  • Supply chain disruptions          |
|  • QRSAM and long-range radar procurements |  • High entry valuation multiples    |
+-----------------------------------------------------------------------------------+
Strengths
Unmatched Infrastructure: Nine specialized manufacturing facilities across India with highly skilled engineering staff.
Deep R&D Focus: Reinvests ~6–7% of annual revenues into internal research and development.
Robust Financials: Debt-free balance sheet with healthy return ratios and cash reserves.
Weaknesses
Client Concentration: Over 85% of revenue depends on procurement budgets from the Indian Armed Forces.
Import Reliance for Components: Certain advanced semiconductors and optical components remain subject to global supply chain delays.
Opportunities
Export Expansion: Growing demand for coastal radar networks and tactical communications across Southeast Asia and Africa.
Non-Defence Diversification: Opportunities in EVM manufacturing, smart city infrastructure, and medical electronics.
Threats
Private Sector Competition: Policy changes allowing private defence firms to bid for major electronics tenders.
Geopolitical & Supply Disruptions: Potential delays in securing raw materials or foreign components due to international conflicts.
Comprehensive Risk Analysis
Investors in Bharat Electronics should keep key operational and market risks in mind:
Execution Schedule Risk: Complex electronic warfare and radar systems require extensive testing and field trials. Any delays in customer sign-off can push revenue recognition into later quarters.
Foreign Exchange Risk: BEL imports high-value specialized modules. Depreciation of the Indian Rupee against major currencies can pressure gross margins.
Policy and Budgetary Changes: Major reallocations in the national defence budget or changes in capital procurement timelines can delay fresh order awards.
Long-Term Investment Thesis
The long-term investment case for Bharat Electronics rests on three structural pillars:
+-----------------------------------------------------------------------------------+
|                         LONG-TERM INVESTMENT THESIS                               |
+-----------------------------------------------------------------------------------+
|  1. STRUCTURAL TAILWINDS: Beneficiary of India's defence indigenisation target.    |
|  2. HIGH REVENUE VISIBILITY: ₹72,258 Cr order backlog provides stable growth.    |
|  3. FINANCIAL STRENGTH: Debt-free sheet, solid margins, and reliable dividends.  |
+-----------------------------------------------------------------------------------+
Dominant Market Position: As electronic content per military platform rises, BEL remains uniquely positioned to capture high-margin subsystem and radar orders across land, air, and sea projects.
Backlog Visibility: With an order book of ₹72,258 Crore as of July 1, 2026, BEL offers clear top-line visibility for over two and a half years.
Disciplined Financial Management: Zero long-term debt, controlled working capital cycles, high return ratios, and regular dividend payouts make BEL a baseline holding for defence-focused portfolios.
Investor Suitability Profile
| Investor Category | Suitability Assessment | Key Strategic Rationale |
| Long-Term Investors | Highly Suitable | Clear multidecadal growth visibility linked to national defence modernization programs. |
| Dividend / Income Investors | Suitable | Consistent dividend payout record backed by a debt-free balance sheet and net positive cash flow. |
| Growth Investors | Moderately Suitable | Top-line growth (15-18%) is reliable, though constrained by industrial production cycles. |
| Value Investors | Less Suitable | Trading at ~49x TTM P/E, the stock trades at premium valuation multiples. |
| Tactical Traders | Suitable on Dips | High liquidity and clear technical support levels make it attractive during market pullbacks. |
Key Takeaways
Strong Top-Line Revenue Growth: Standalone operating revenue grew by 25.27% YoY in Q1 FY27, reaching ₹5,533.06 Crore.
Solid Net Profit Performance: Standalone Profit After Tax (PAT) rose 8.17% YoY to ₹1,048.33 Crore.
Robust Order Backlog: Total order book stood at ₹72,258 Crore as of July 1, 2026, providing multi-year execution visibility.
Authorised Capital Expansion: The Board approved raising the Authorised Share Capital from ₹750 Crore to ₹1,000 Crore.
EBITDA Margin Moderation: Standalone EBITDA margin settled at 28.13% due to material consumption mix variations.
Fresh Contract Wins: Secured key orders during Q1, including Mountain Radars (₹1,950 Cr) and Ground Mobile Electronics (₹1,476 Cr).
Debt-Free Balance Sheet: Operates with zero long-term debt and maintains negligible interest costs.
Consistent Earnings Per Share: Standalone Q1 FY27 EPS reached ₹1.43 per share.
Annual Guidance Intact: Management targets 15–18% revenue growth and 25–27% EBITDA margins for FY27.
Consistent Dividend Strategy: Confirmed previous final dividend recommendation of 55% (₹0.55 per share) for FY26.
Overhead Cost Management: Operating expenses fell 18.96% YoY, helping buffer raw material costs.
Strong Cash Reserves: Treasury operations continue to generate reliable supplementary interest income.
High Domestic Content: Indigenisation levels remain around 70–80%, reducing foreign currency reliance.
Positive Analyst Outlook: Sell-side consensus remains favorable, with ~85% of analysts maintaining Buy ratings.
Strategic Alignment: Directly benefits from government indigenisation policies and expanding MoD spending.



