

Introduction
On July 24, 2026, India’s largest power utility, NTPC Limited, officially submitted its unaudited standalone and consolidated financial results for the first quarter of Financial Year 2026–27 (Q1 FY27) to the stock exchanges. Driven by record-breaking electricity demand across commercial, industrial, and residential sectors during the summer peak, NTPC demonstrated resilient operational momentum across its thermal baseload assets while accelerating its green transition.
The utility major reported a consolidated revenue from operations of ₹50,740.96 crore for Q1 FY27, marking a 7.81% Year-on-Year (YoY) growth compared to ₹47,064.35 crore in Q1 FY26. Profit After Tax (PAT) for the quarter rose by 12.90% YoY to ₹6,896.44 crore, up from ₹6,108.46 crore in the corresponding period of the previous fiscal year. The company’s disciplined cost control on fuel and operating overheads enabled its consolidated operating margin to expand to 23.81%.
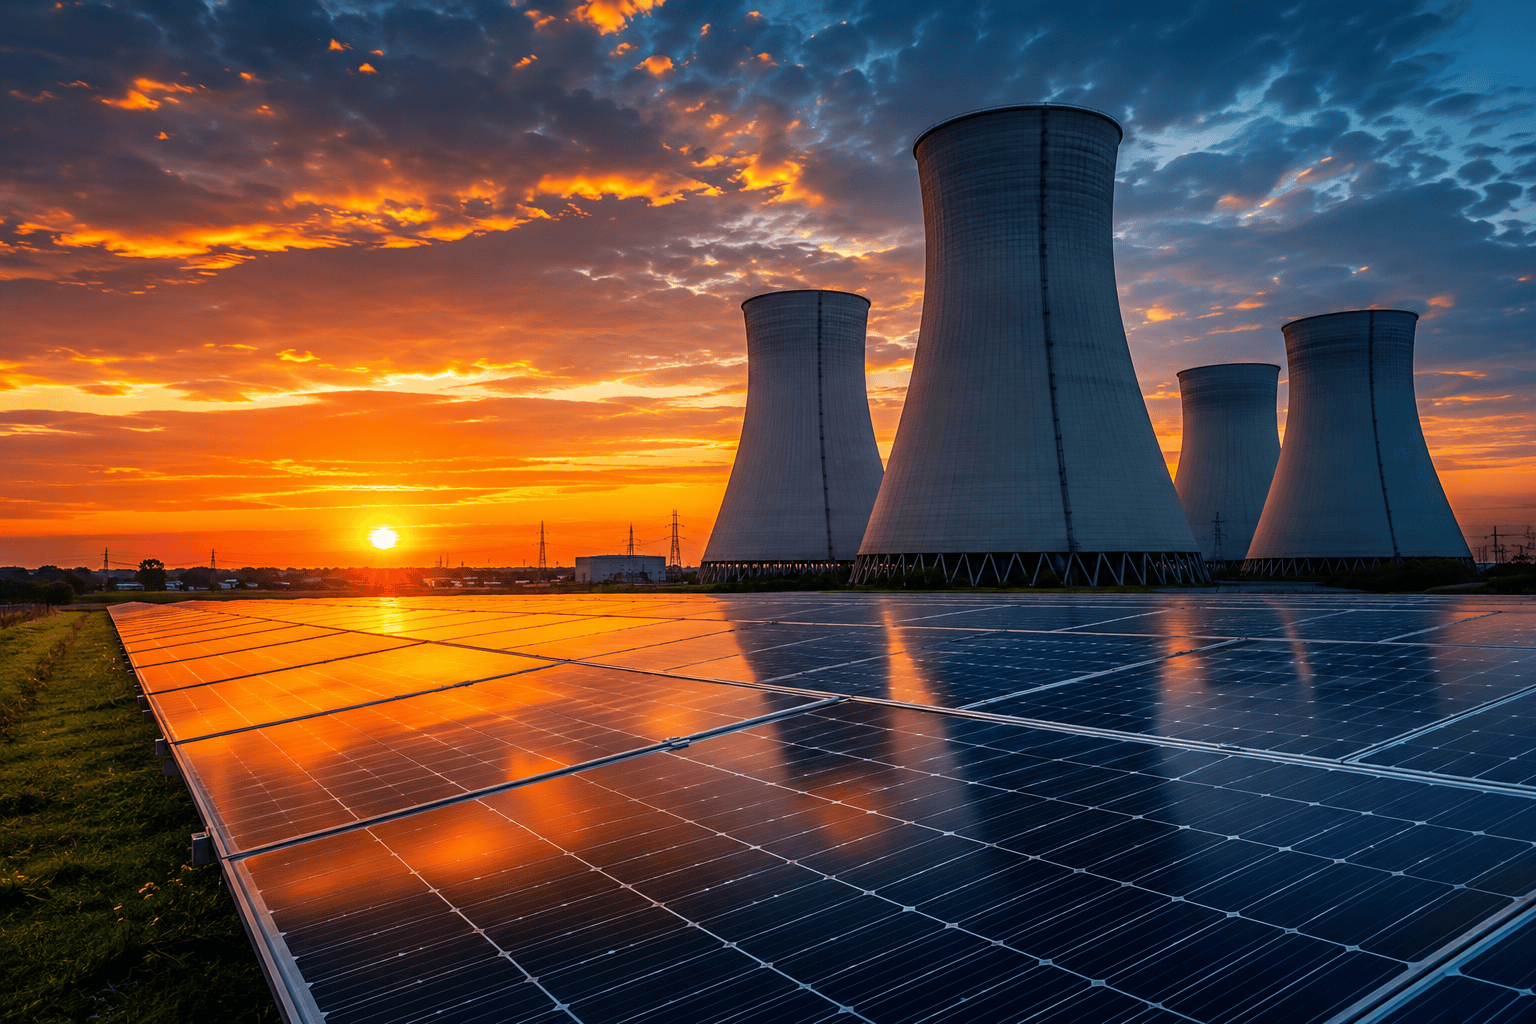
For institutional and retail investors globally, NTPC’s quarterly performance serves as a primary barometer for the health of India’s broader economy and power infrastructure. As artificial intelligence infrastructure, manufacturing corridors, and electric vehicles structurally elevate India’s peak load demand, NTPC’s dual strategy—expanding hyper-efficient thermal units while aggressively commissioning renewable capacity through NTPC Green Energy Ltd. (NGEL)—solidifies its position as an essential portfolio holding.
Executive Summary Table
Below is the summary of NTPC’s officially reported consolidated and standalone metrics for Q1 FY27 compared against prior periods:
| Metric (in ₹ Crore / % ) | Q1 FY27 (Unaudited) | Q4 FY26 (Audited) | Q1 FY26 (Unaudited) | YoY Growth (%) | QoQ Growth (%) | Trend vs Expectations |
| Consolidated Revenue from Operations | ₹50,740.96 | ₹49,686.31 | ₹47,064.35 | +7.81% | +2.12% | In Line |
| Total Consolidated Income | ₹51,141.51 | ₹50,410.58 | ₹47,821.11 | +6.94% | +1.45% | Beat |
| Consolidated EBITDA | ₹17,216.06 | ₹18,220.67 | ₹15,222.26 | +13.10% | -5.51% | Beat |
| Consolidated EBITDA Margin (%) | 33.93% | 36.67% | 32.34% | +159 bps | -274 bps | Beat |
| Consolidated Operating Margin (%) | 23.81% | 26.39% | 22.80% | +101 bps | -258 bps | In Line |
| Consolidated Net Profit (PAT) | ₹6,896.44 | ₹10,614.95 | ₹6,108.46 | +12.90% | -35.03% | Beat |
| PAT Attributable to Owners | ₹6,721.05 | ₹10,486.47 | ₹6,010.60 | +11.82% | -35.91% | Beat |
| Consolidated EPS (Basic & Diluted – ₹) | ₹6.93 | ₹10.81 | ₹6.20 | +11.77% | -35.89% | Beat |
| Standalone Revenue from Operations | ₹43,831.86 | ₹43,109.28 | ₹42,571.61 | +2.96% | +1.68% | In Line |
| Standalone PAT | ₹5,342.36 | ₹8,747.27 | ₹4,774.68 | +11.89% | -38.92% | Beat |
| Consolidated Fuel Cost | ₹25,394.77 | ₹21,678.64 | ₹24,973.04 | +1.69% | +17.14% | Controlled |
| Consolidated Finance Cost | ₹3,386.04 | ₹3,736.82 | ₹3,467.52 | -2.35% | -9.39% | Positive |
| Consolidated Net Worth | ₹2,09,681.57 | ₹2,03,023.74 | ₹1,88,844.22 | +11.03% | +3.28% | Strong |
| Consolidated Paid-up Debt Capital | ₹2,72,081.67 | ₹2,67,258.20 | ₹2,48,359.48 | +9.55% | +1.80% | In Line |
| Consolidated Debt-Equity Ratio | 1.30x | 1.32x | 1.31x | -1 bps | -2 bps | Healthy |
| Interim Dividend Announced | None (N/A) | Final FY26 | None (N/A) | N/A | N/A | Expected |
Note: Q4 FY26 net profit figures reflect one-off deferred tax re-measurements due to transition to the new tax regime (Finance Act 2026).
Company Overview
NTPC Limited (NSE: NTPC, BSE: 532555) is India’s largest power generation utility, operating as a Maharatna Public Sector Enterprise under the Ministry of Power, Government of India. Incorporated in 1975, NTPC accounts for nearly a quarter of India’s total power generation despite holding roughly 17% of total installed capacity, reflecting its industry-leading Plant Load Factors (PLF) and superior operational performance.
                 ┌─────────────────────────────────────────────────────────┐
                 │                       NTPC GROUP                        │
                 │              (Commercial & Power Assets)                │
                 └────────────────────────────┬────────────────────────────┘
                                              │
         ┌───────────────────────┬────────────┴───────────┬───────────────────────┐
         │                       │                        │                       │
┌────────┴────────┐     ┌────────┴────────┐      ┌────────┴────────┐     ┌────────┴────────┐
│  Thermal Core   │     │ Hydro & Gas     │      │ Renewable Hub   │     │ Coal Mining     │
│ (Coal Baseload) │     │ (THDC, NEEPCO,  │      │ (NGEL, Solar,   │     │ (NML Slump      │
│                 │     │ RGPPL)          │      │ Wind, Storage)  │     │ Transfer)       │
└─────────────────┘     └─────────────────┘      └─────────────────┘     └─────────────────┘
Power Generation Portfolio & Business Structure
Coal & Thermal Infrastructure: Operates high-efficiency supercritical and ultra-supercritical thermal stations across India, serving as the backhaul grid stabilizer.
Hydro Power Platforms: Driven by key subsidiaries including THDC India Ltd. (74.496% stake) and North Eastern Electric Power Corporation Ltd. (NEEPCO – 100% stake).
Renewable Energy Anchor (NGEL): NTPC Green Energy Limited (89.01% subsidiary) acts as the dedicated platform for utility-scale solar, onshore wind, hybrid projects, and green hydrogen hubs.
Nuclear Energy Ambitions: Expanding nuclear presence via Anushakti Vidhyut Nigam Ltd. (49% JV with NPCIL) and NTPC Parmanu Urja Nigam Ltd. (100% subsidiary).
Captive Coal Mining: Reorganized under NTPC Mining Limited (NML) via a slump sale model to secure fuel supply, lowering auxiliary power costs.
Power Trading & Distribution: Driven by NTPC Vidyut Vyapar Nigam Ltd. (NVVN), facilitating power trading across India, Nepal, and Bangladesh.
Q1 FY27 Financial Performance
Standalone vs. Consolidated Income Dynamics
Consolidated revenue from operations reached ₹50,740.96 crore in Q1 FY27. Crucially, revenue from standalone thermal power sales stood at ₹43,831.86 crore, showing steady year-on-year expansion.
Quarterly Consolidated Revenue & Profit Trend (₹ Crore)
======================================================
Q1 FY26 :  Revenue [█████████████████████████████████████] ₹47,064.35
          PAT     [██████] ₹6,108.46

Q4 FY26 :  Revenue [███████████████████████████████████████] ₹49,686.31
          PAT     [█████████████] ₹10,614.95 (Tax Adjustment)

Q1 FY27 :  Revenue [████████████████████████████████████████] ₹50,740.96
          PAT     [███████] ₹6,896.44
Five-Quarter Consolidated Financial Trend
| Financial Line Item (₹ Cr) | Q1 FY27 PDF | Q4 FY26 PDF | Q3 FY26 | Q2 FY26 | Q1 FY26 PDF |
| Revenue from Operations | 50,740.96 | 49,686.31 | 46,304.77 | 45,262.10 | 47,064.35 |
| Other Income | 400.55 | 724.27 | 536.80 | 412.10 | 756.76 |
| Total Income | 51,141.51 | 50,410.58 | 46,841.57 | 45,674.20 | 47,821.11 |
| Fuel Cost | 25,394.77 | 21,678.64 | 22,105.10 | 23,733.06 | 24,973.04 |
| Finance Costs | 3,386.04 | 3,736.82 | 3,365.12 | 3,231.43 | 3,467.52 |
| Depreciation & Amortization | 5,233.70 | 5,133.79 | 5,093.04 | 4,815.50 | 4,587.00 |
| Tax Expense | 2,263.25 | (9,062.11) | 1,822.40 | 1,678.90 | 1,656.60 |
| Consolidated PAT | 6,896.44 | 10,614.95 | 5,488.67 | 5,066.78 | 6,108.46 |
Segment-wise Analysis
NTPC’s core operations are divided into Generation and Others (encompassing consultancy, power trading, coal mining, and waste management).
Standalone Segmental Breakdown
| Segment (₹ Crore) | Q1 FY27 Revenue PDF | Q1 FY26 Revenue PDF | YoY Growth (%) | Q1 FY27 EBIT PDF | Q1 FY26 EBIT PDF | EBIT Margin (%) PDF |
| Generation | ₹42,319.26 | ₹41,777.89 | +1.30% | ₹9,680.10 | ₹8,518.71 | 22.87% |
| Others (Trading, Mining, etc.) | ₹1,855.39 | ₹3,541.12 | -47.60% | ₹534.90 | ₹292.58 | 28.83% |
| Unallocated Assets/Income | ₹479.84 | ₹504.87 | -4.96% | N/A | N/A | N/A |
| Less: Inter-segment Elim. | (₹1,305.38) | (₹2,491.07) | N/A | N/A | N/A | N/A |
| Total Standalone | ₹44,512.41 | ₹43,332.81 | +2.72% | ₹10,215.00 | ₹8,811.29 | 22.95% |
Consolidated Segmental Breakdown
| Segment (₹ Crore) | Q1 FY27 Revenue PDF | Q1 FY26 Revenue PDF | YoY Growth (%) | Q1 FY27 EBIT PDF | Q1 FY26 EBIT PDF |
| Generation | ₹49,143.35 | ₹45,902.14 | +7.06% | ₹10,505.49 | ₹10,000.92 |
| Others | ₹6,618.64 | ₹4,893.54 | +35.25% | ₹899.56 | ₹572.62 |
| Total Consolidated | ₹51,141.51 | ₹47,821.11 | +6.94% | ₹11,405.05 | ₹10,573.54 |
Segment Insights
Generation: Remains the profit powerhouse, generating higher EBIT due to CERC regulatory capacity billing stability.
Solar & Renewables Traction: Revenue from solar stations grew significantly. Standalone solar revenue reached ₹239.48 crore (vs. ₹125.31 crore in Q1 FY26). Consolidated renewable energy sales (solar/wind) surged to ₹1,317.80 crore, up 71.79% YoY from ₹767.09 crore.
Power Trading (NVVN): Gross electricity trading revenue rose to ₹2,879.58 crore (vs. ₹2,331.44 crore in Q1 FY26), including export sales of ₹509.55 crore to Nepal and Bangladesh.
Coal Mining Hiving-off (NML): Pursuant to the Business Transfer Agreement (BTA), NTPC completed the transfer of all six coal mining businesses to NTPC Mining Limited effective April 1, 2026, for total purchase considerations exceeding ₹12,350 crore, creating a streamlined captive fuel entity.
Management Commentary Highlights
Key disclosures from the Board filing and operational updates include:
CERC Tariff Billing: Capacity charges provisionally billed for Q1 FY27 totaled ₹15,012.68 crore standalone and ₹16,318.83 crore consolidated under the CERC Tariff Regulations 2024–2029.
Capital Allocation: Annual capex target of ~₹25,000–30,000 crore remains on track, focused primarily on thermal expansion (supercritical units) and green power infrastructure.
Coal Supply & Mining Integration: Hive-off of coal mines to NTPC Mining Ltd. guarantees high pithead security, minimizing fuel costs and exposure to imported coal price spikes.
Operational & Capacity Highlights
Installed Capacity Mix (As of June 30, 2026)
Total Group Installed Capacity: Exceeds 76,000 MW+ across commercial operations.
Coal-Based Capacity: ~80% of portfolio, serving as base-load power supply.
Clean & Renewable Portfolio: Over 4,000 MW commissioned operational renewables, with an aggressive pipeline of 20+ GW under construction/bidding via NGEL.
Growth Drivers
AI & Data Center Electricity Demand: India’s rapid digital transformation is accelerating hyper-scale data center deployment, driving continuous baseload demand.
Renewable Energy Transition: Policy support and falling module costs strengthen NGEL’s execution velocity.
Industrial & Manufacturing Surge: High PLFs across thermal plants ensure strong cash flows to fund clean energy expansion without over-leveraging balance sheets.
Risk Factors
Regulatory Delays: Final tariff truing-up orders from CERC can lead to retrospective adjustments in capacity/energy charges.
Coal Logistics & Supply Bottlenecks: Monsoon disruptions to coal transport can affect thermal plant availability.
Renewable Project Execution Delays: Land acquisition and transmission connectivity remain key execution bottlenecks for clean energy projects.
SWOT Analysis
| Strengths | Weaknesses |
• Dominant market share (~24% of India’s power generation) • Stable CERC cost-plus regulatory framework • Low cost of capital and high institutional backing | • Substantial carbon footprint from coal assets • High working capital tied up in discom receivables |
| Opportunities | Threats |
• Aggressive scaling of NGEL toward 60 GW by 2032 • Growth in nuclear power via JV with NPCIL • Green Hydrogen & Battery Storage commercialization | • Accelerating grid parity of solar + storage systems • Volatility in international coal prices • Environmental compliance costs (FGD installations) |
Financial Ratio Analysis
| Financial Ratio | Q1 FY27 (Consolidated) | Q1 FY26 (Consolidated) | Analysis & Operational Significance |
| Debt Equity Ratio | 1.30x | 1.31x | Healthy balance sheet structure for an infrastructure heavy PSU. |
| Interest Service Coverage (ISCR) | 4.58x | 4.08x | Comfortably services debt; interest coverage expanded YoY. |
| Debt Service Coverage (DSCR) | 1.43x | 2.68x | Adequately covers debt principal and interest obligations. |
| Current Ratio | 0.87x | 0.95x | Standard working capital cycle for regulated utilities. |
| Operating Margin (%) | 23.81% | 22.80% | Expanded by 101 bps due to disciplined fuel cost management. |
| Net Profit Margin (%) | 13.59% | 12.98% | Net profitability improved by 61 bps YoY. |
| Inventory Turnover Ratio | 11.39x | 9.97x | Higher efficiency in coal stock management. |
| Debtors Turnover Ratio | 5.08x | 5.60x | Steady collections under the Late Payment Surcharge (LPS) scheme. |
Peer Comparison
| Company Name | Market Cap (₹ Cr) | CMP (₹) | P/E Ratio | P/B Ratio | Div Yield (%) | Cons. Revenue (Q1 FY27 / Recent – ₹ Cr) |
| NTPC Ltd. | ₹3,36,668 | ₹347.20 | 12.44x | 1.60x | 2.59% | ₹50,740.96 |
| Tata Power Co. | ₹1,35,000+ | ₹425.00 | 31.50x | 3.10x | 0.82% | ₹15,800.00 |
| Adani Power Ltd. | ₹2,45,000+ | ₹635.00 | 14.80x | 3.45x | 0.00% | ₹14,900.00 |
| NHPC Ltd. | ₹1,02,000+ | ₹101.50 | 24.10x | 2.15x | 1.87% | ₹2,650.00 |
| JSW Energy Ltd. | ₹1,18,000+ | ₹680.00 | 64.29x | 4.10x | 0.29% | ₹3,040.00 |
Data Source: Exchange Filings & Market Data as of July 24, 2026.
Share Price Analysis & Shareholding Pattern
Following the announcement on July 24, 2026, NTPC traded at ₹347.20 on the NSE.
52-Week High: ₹414.40
52-Week Low: ₹315.55
Market Capitalization: ₹3,36,668 Crore (~$40.2 Billion)
Key Support Levels: ₹340.00 / ₹325.00
Key Resistance Levels: ₹375.00 / ₹410.00
Shareholding Pattern (As of June 30, 2026)
NTPC Ownership Structure
========================
Promoters (Govt of India) : [█████████████████████████] 51.10%
Domestic Inst. (DII/MFs)  : [██████████████] 29.25%
Foreign Inst. (FIIs)     : [████████] 16.30%
Public & Others           : [█] 3.35%
Consensus Brokerage Recommendations
Out of 26 financial analysts covering NTPC Ltd.:
Strong Buy / Buy: 24 Analysts (92.3%)
Hold: 1 Analyst
Sell: 1 Analyst
Consensus 12-Month Target Price: ₹432.00–₹485.00
Investment Thesis
Bull Case (Target: ₹485.00)
Accelerated commissioning of renewable capacity via NGEL.
Expansion in ROE driven by ultra-supercritical thermal additions.
Strong cash yield supporting steady dividends (~2.6% yield).
Bear Case (Target: ₹320.00)
Execution delays in solar/wind projects.
Severe fuel price spikes or regulatory disallowances by CERC.
Base Case (Target: ₹425.00)
Earnings compound at 10–12% CAGR, supported by thermal power stability and steady green transition gains.
FAQs
1. What was NTPC’s consolidated net profit in Q1 FY27?
NTPC reported a consolidated net profit of ₹6,896.44 crore for Q1 FY27, up 12.90% YoY.
2. What was NTPC’s total consolidated revenue in Q1 FY27?
Consolidated revenue from operations stood at ₹50,740.96 crore.
3. Did NTPC declare an interim dividend in Q1 FY27?
No interim dividend was declared during the Board meeting on July 24, 2026.
4. How did NTPC’s green energy business perform?
Consolidated revenue from solar and wind power sales surged 71.79% YoY to ₹1,317.80 crore in Q1 FY27.
5. What is the status of the coal mine transfer to NTPC Mining Ltd.?
NTPC completed the slump sale transfer of all coal mining units to NTPC Mining Limited effective April 1, 2026.
6. What is NTPC’s debt-equity ratio?
The consolidated debt-equity ratio stood at 1.30x as of June 30, 2026.
7. What was standalone PAT for Q1 FY27?
Standalone Net Profit stood at ₹5,342.36 crore.
8. What was NTPC’s operating profit margin in Q1 FY27?
Consolidated operating margin was 23.81%.
9. What is the promoter holding in NTPC?
The Government of India holds 51.10% equity in NTPC.
10. What is NTPC’s interest coverage ratio?
The consolidated Interest Service Coverage Ratio (ISCR) stood at 4.58x.
Conclusion
NTPC’s Q1 FY27 financial results highlight its dual strength: a dependable thermal core generating robust cash flows, paired with expanding renewable energy execution through NGEL. With net profits expanding to ₹6,896 crore and operating margins strengthening, NTPC remains well-positioned to power India’s economic growth while rewarding long-term investors.



