

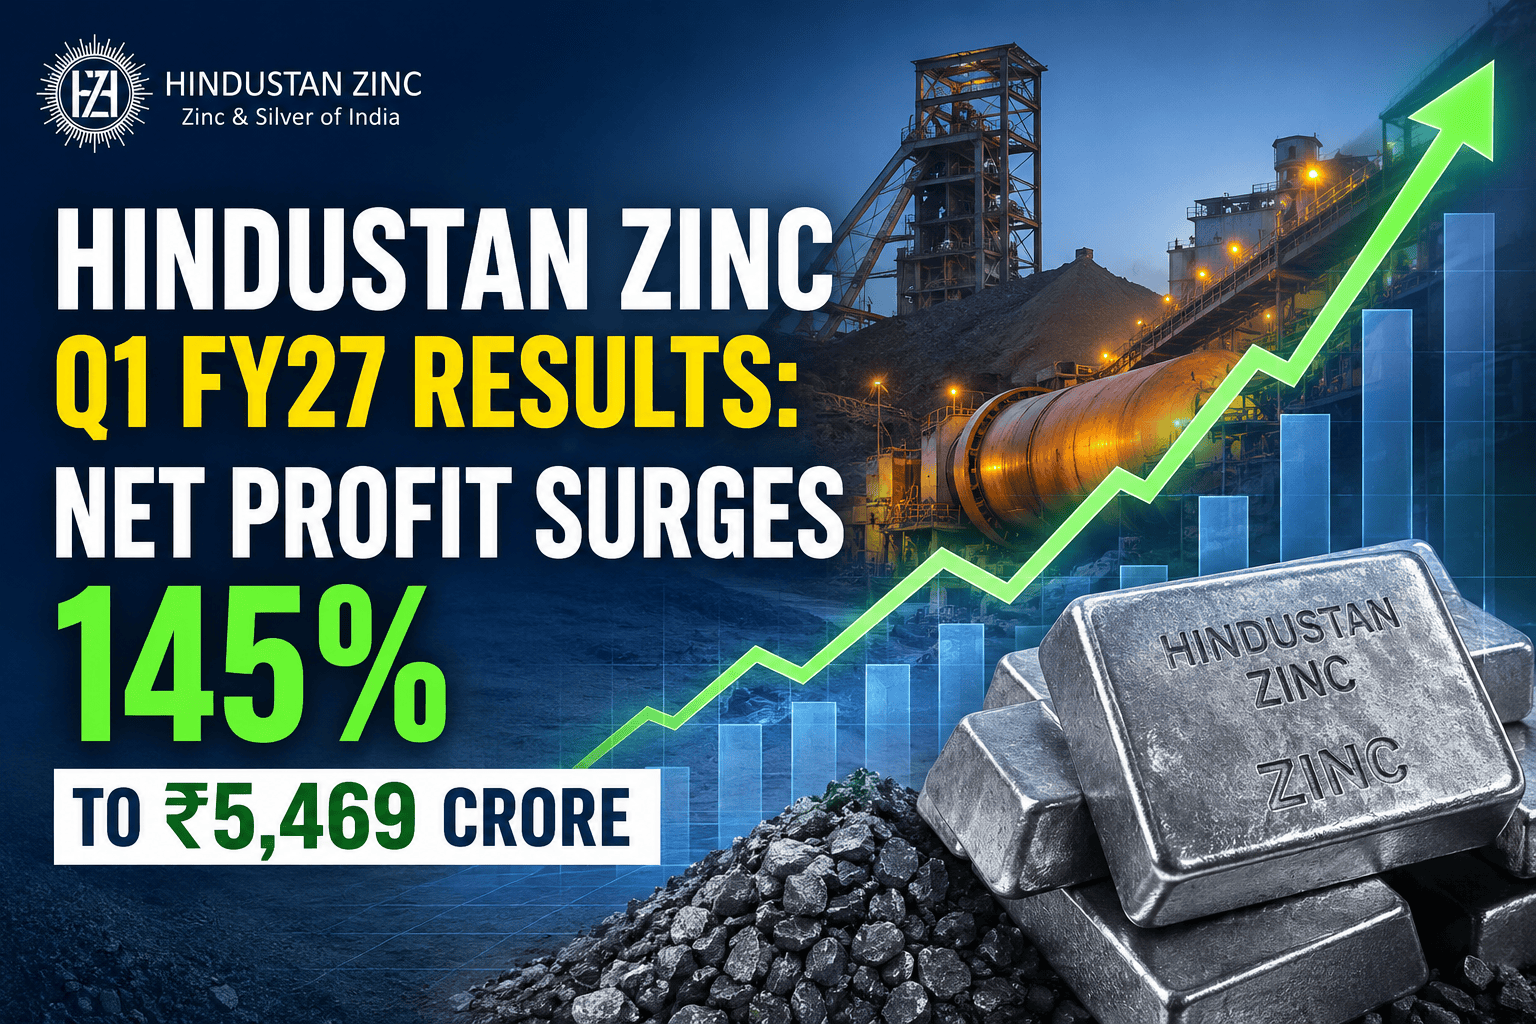
Hindustan Zinc Limited, a Vedanta Group entity and India’s primary integrated producer of zinc, lead, and silver, disclosed its financial results for the first quarter of FY27 (quarter ended June 30, 2026) following its Board of Directors meeting on July 24, 2026. The company reported a 144.80% year-on-year (YoY) increase in consolidated Net Profit (PAT) to ₹5,469 crore, up from ₹2,234 crore in Q1 FY26. Total consolidated revenue from operations expanded 76.90% YoY to ₹13,747 crore compared to ₹7,771 crore in the corresponding prior period.
The quarter’s performance was propelled by market realizations in silver alongside volume contributions from core zinc and lead mining operations. Silver segment revenue surged 169.21% YoY to ₹3,839 crore. Operating efficiencies and debottlenecking across smelting facilities enabled the company’s zinc cost of production (excluding royalty) to drop to $851 per metric ton. The balance sheet saw debt reduction, bringing the debt-to-equity ratio down to 0.31 from 1.19 a year earlier.
Key Highlights
Consolidated Net Profit (PAT): ₹5,469 crore, up 144.80% YoY (vs ₹2,234 crore in Q1 FY26) and up 8.66% QoQ (vs ₹5,033 crore in Q4 FY26).
Consolidated Revenue from Operations: ₹13,747 crore (+76.90% YoY and +1.50% QoQ).
Silver Segment Revenue: ₹3,839 crore, up 169.21% YoY from ₹1,426 crore in Q1 FY26.
Mined Metal Production: 268 kilotonnes (KT), marking the highest first-quarter output for the fifth consecutive year (+1% YoY).
Refined Metal Production: 260 KT, up 4% YoY. Refined zinc output rose 6% YoY to 213 KT.
Zinc Cost of Production (ex-royalty): Fell to $851/MT, down 16% YoY and 6% QoQ.
EBIT Operating Margin: Expanded to 52%, compared to 38% in Q1 FY26 and 49% in Q4 FY26.
Debt-to-Equity Ratio: Improved to 0.31 from 1.19 in Q1 FY26.
Basic & Diluted EPS: Stood at ₹12.94 per share of face value ₹2 each.
Company Snapshot
| Particular | Details |
| Company Name | Hindustan Zinc Limited |
| Sector | Metals & Mining |
| Industry | Non-Ferrous Metals (Zinc, Lead, Silver) |
| Market Capitalization | ~₹2.24 Lakh Crore (Large Cap) |
| Promoter / Parent | Vedanta Limited (Vedanta Group) |
| Headquarters | Yashad Bhawan, Udaipur, Rajasthan, India |
| Primary Products | Zinc, Lead, Silver, Sulphuric Acid, Wind Power |
| Primary Facilities | Chanderiya, Dariba, Debari, Zawar Mines |
| NSE Symbol | HINDZINC |
| BSE Scrip Code | 500188 |
Q1 FY27 Financial Highlights
+-------------------------------------------------------------------------+
|                HINDUSTAN ZINC Q1 FY27 FINANCIAL SNAPSHOT                |
|                                                                         |
|  CONSOLIDATED NET PROFIT (PAT)                                          |
|  Q1 FY26:  [₹2,234 Cr]                                                 |
|  Q4 FY26:  [₹5,033 Cr]                                                 |
|  Q1 FY27:  [=========================> ₹5,469 Cr (+144.80% YoY)]       |
|                                                                         |
|  CONSOLIDATED REVENUE FROM OPERATIONS                                   |
|  Q1 FY26:  [₹7,771 Cr]                                                 |
|  Q4 FY26:  [₹13,544 Cr]                                                |
|  Q1 FY27:  [=======================> ₹13,747 Cr (+76.90% YoY)]          |
+-------------------------------------------------------------------------+
Consolidated Quarterly Statement (in ₹ Crores)
| Particulars | Q1 FY27 (Unaudited) | Q4 FY26 (Audited) | Q1 FY26 (Unaudited) | YoY Growth (%) | QoQ Growth (%) |
| Revenue from Operations | 13,033 | 12,692 | 7,591 | +71.69% | +2.69% |
| Other Operating Revenue | 714 | 852 | 180 | +296.67% | -16.20% |
| Total Revenue from Operations | 13,747 | 13,544 | 7,771 | +76.90% | +1.50% |
| Other Income | 316 | 280 | 279 | +13.26% | +12.86% |
| Total Income | 14,063 | 13,824 | 8,050 | +74.69% | +1.73% |
| Changes in Inventories (FG & WIP) | (56) | (254) | (12) | — | — |
| Employee Benefit Expense | 204 | 185 | 192 | +6.25% | +10.27% |
| Depreciation & Amortisation | 920 | 1,048 | 913 | +0.77% | -12.21% |
| Power and Fuel | 699 | 627 | 632 | +10.60% | +11.48% |
| Mining Royalty | 1,536 | 1,710 | 909 | +68.98% | -10.18% |
| Finance Costs | 132 | 187 | 240 | -45.00% | -29.41% |
| Other Expenses | 3,314 | 3,570 | 2,191 | +51.26% | -7.17% |
| Total Expenses | 6,749 | 7,073 | 5,065 | +33.25% | -4.58% |
| Profit Before Tax (PBT) | 7,314 | 6,751 | 2,985 | +145.03% | +8.34% |
| Net Tax Expense | 1,845 | 1,718 | 751 | +145.67% | +7.39% |
| Net Profit (PAT) | 5,469 | 5,033 | 2,234 | +144.80% | +8.66% |
| Basic & Diluted EPS (₹) | 12.94 | 11.91 | 5.29 | +144.61% | +8.65% |
Standalone vs. Consolidated Comparison
Financial Metrics Comparison (Q1 FY27)
| Metric (in ₹ Crores) | Standalone (Q1 FY27) | Consolidated (Q1 FY27) | Difference / Sub-Entity Contribution |
| Total Revenue from Operations | 13,687 | 13,747 | ₹60 Cr from subsidiaries |
| Other Income | 315 | 316 | ₹1 Cr |
| Total Expenses | 6,743 | 6,749 | ₹6 Cr |
| Profit Before Tax (PBT) | 7,259 | 7,314 | ₹55 Cr |
| Net Profit (PAT) | 5,425 | 5,469 | ₹44 Cr from subsidiaries |
| Basic EPS (₹) | 12.84 | 12.94 | +0.10 EPS contribution |
| Net Worth | 23,386 | 23,587 | ₹201 Cr |
Revenue Analysis
Consolidated revenue from operations for Q1 FY27 stood at ₹13,747 crore, driven by realisations across silver and base metals. On a standalone basis, revenue from operations reached ₹13,687 crore.
Operational & Pricing Drivers
Silver Realizations: Revenue from silver reached ₹3,839 crore in Q1 FY27, representing a 169.21% increase over ₹1,426 crore in Q1 FY26. Silver contributed approximately 28% of overall consolidated top-line revenue.
Zinc & Lead Core Growth: The core Zinc, Lead, and other by-products segment delivered revenues of ₹9,146 crore, expanding 49.54% YoY from ₹6,116 crore in Q1 FY26.
By-Product Credits: Realizations from sulphuric acid rose approximately 200% YoY, generating by-product credits that reduced net metal production costs.
+-------------------------------------------------------------------------+
|             SEGMENT REVENUE SHARE COMPARISON (Q1 FY27)                  |
|                                                                         |
|  Zinc, Lead & Others:  [==========================>] ₹9,146 Cr (66.5%)   |
|  Silver Segment:       [============>] ₹3,839 Cr (27.9%)                |
|  Other Operating Rev:  [==>] ₹714 Cr (5.2%)                            |
|  Wind Energy:          [>] ₹48 Cr (0.4%)                                |
+-------------------------------------------------------------------------+
Cost Structure & Margin Analysis
Total expenses for Q1 FY27 were ₹6,749 crore, representing a controlled increase of 33.25% YoY against a top-line growth of 76.90%. Operating leverage led to margin expansion.
Cost Components Breakdown
Mining Royalty: Royalty payments rose 68.98% YoY to ₹1,536 crore (vs ₹909 crore in Q1 FY26), reflecting higher metal prices and revenue-linked statutory payments.
Power and Fuel: Power and fuel expenses stood at ₹699 crore, up 10.60% YoY from ₹632 crore. Increased consumption of renewable energy (reaching ~70% of total operational power needs) mitigated global coal price impacts.
Finance Costs: Interest expenses decreased 45.00% YoY to ₹132 crore from ₹240 crore in Q1 FY26, driven by lower total borrowings and debt repayments.
Zinc Cost of Production (COP): Zinc cost of production (excluding royalty) declined to $851 per metric ton—a 16% YoY and 6% QoQ drop—marking its lowest quarterly operating cost level since transitioning to underground mining.
+-------------------------------------------------------------------------+
|                     MARGIN TRAJECTORY (Q1 FY26 - Q1 FY27)               |
|                                                                         |
|  Operating Margin (EBIT):                                              |
|  Q1 FY26: [38%] ========> Q4 FY26: [49%] ========> Q1 FY27: [52%]|
|                                                                         |
|  Net Profit Margin (PAT):                                              |
|  Q1 FY26: [29%] ========> Q4 FY26: [37%] ========> Q1 FY27: [40%]|
+-------------------------------------------------------------------------+
Segment-Wise Performance
Hindustan Zinc reports operations under two primary business segments: Zinc, Lead and Silver and Wind Energy.
Segment Revenue and Results (in ₹ Crores)
| Segment Particulars | Q1 FY27 (Unaudited) | Q4 FY26 (Audited) | Q1 FY26 (Unaudited) | YoY Growth (%) |
| Segment Revenue | ||||
| (i) Zinc, Lead and others | 9,146 | 8,640 | 6,116 | +49.54% |
| (ii) Silver | 3,839 | 4,032 | 1,426 | +169.21% |
| Total Metals Segment Revenue | 12,985 | 12,672 | 7,542 | +72.17% |
| Wind Energy | 48 | 20 | 49 | -2.04% |
| Total Segment Revenue | 13,033 | 12,692 | 7,591 | +71.69% |
| Other Operating Income | 714 | 852 | 180 | +296.67% |
| Total Operating Income | 13,747 | 13,544 | 7,771 | +76.90% |
| Segment Results (PBT & Finance Cost) | ||||
| (i) Zinc, Lead and others | 3,846 | 3,350 | 1,735 | +121.67% |
| (ii) Silver | 3,327 | 3,396 | 1,232 | +170.05% |
| Total Metals Segment Result | 7,173 | 6,746 | 2,967 | +141.76% |
| Wind Energy | 27 | 4 | 29 | -6.90% |
| Total Segment Results | 7,200 | 6,750 | 2,996 | +140.32% |
Operational & Production Performance
Q1 FY27 Production Summary
| Production Metric | Q1 FY27 | Q1 FY26 | Q4 FY26 | YoY Change (%) | QoQ Change (%) |
| Mined Metal Production | 268 KT | 265 KT | 315 KT | +1.13% | -14.92% |
| Refined Saleable Metal | 260 KT | 250 KT | 283 KT | +4.00% | -8.13% |
| Refined Zinc Output | 213 KT | 202 KT | 227 KT | +5.45% | -6.17% |
| Refined Lead Output | 47 KT | 48 KT | 55 KT | -2.08% | -14.55% |
| Saleable Silver Volume | 149 MT | 150 MT | 176 MT | -0.40% | -15.34% |
| Wind Power Generation | 133 MU | 134 MU | 56 MU | -0.75% | +137.50% |
Mined metal output reached 268 KT, establishing a record for first-quarter volume for the fifth consecutive fiscal year, supported by improved ore grades. Refined metal growth was driven by debottlenecking initiatives at the Chanderiya and Dariba facilities alongside commissioning of the 160 KTPA roaster unit at Debari.
Balance Sheet, Capital Structure & Solvency Ratios
The company strengthened its balance sheet during the quarter through cash generation and structured debt paydowns. Net worth increased to ₹23,587 crore as of June 30, 2026, compared to ₹11,345 crore as of June 30, 2025.
Key Balance Sheet & Financial Ratios
| Financial Ratio / Metric | Q1 FY27 | Q4 FY26 | Q1 FY26 | Status / Trend |
| EBIT Operating Margin (%) | 52% | 49% | 38% | Expanded +1400 bps YoY |
| Net Profit Margin (%) | 40% | 37% | 29% | Expanded +1100 bps YoY |
| Debt Service Coverage Ratio (times) | 7.44 | 4.38 | 4.27 | Robust coverage |
| Interest Service Coverage Ratio (times) | 53.02 | 47.92 | 16.25 | Improved 3.25x YoY |
| Debt-to-Equity Ratio (times) | 0.31 | 0.36 | 1.19 | Deleveraged significantly |
| Current Ratio (times) | 2.03 | 2.17 | 1.11 | Liquidity cushion |
| Total Debts to Total Assets (times) | 0.17 | 0.19 | 0.37 | Asset coverage up |
| Debtor Turnover Ratio (times) | 28.40 | 37.85 | 48.27 | Unannualized |
| Inventory Turnover Ratio (times) | 2.62 | 2.79 | 1.91 | Unannualized |
| Consolidated Net Worth (₹ Cr) | 23,587 | 22,629 | 11,345 | Doubled YoY |
Regulatory Disclosures & Corporate Governance Notes
The financial statement filing included regulatory disclosures under Notes 3, 4, and 5:
Interim Dividend Declaration: The Board of Directors on April 24, 2026, declared an interim dividend of ₹11 per equity share, amounting to a payout of ₹4,648 crore. The record date was April 30, 2026.
Reversal of Environment & Health Cess: During FY25, the company had set aside an exceptional provision of ₹56 crore for Environment and Health Cess. Following legal assessments, this provision was reversed in FY26.
Labour Code Impact: An exceptional impact of ₹31 crore was recognized in FY26 regarding leave encashment and gratuity liabilities under the New Labour Codes.
Short-Seller Allegations & SEBI Observations: Addressing short-seller reports published during the prior financial year, management reaffirmed that allegations regarding group entities are baseless, adding that transactions maintain commercial substance and full legal compliance. During Q1 FY27, SEBI shared observations regarding procedural approvals and disclosures for related-party transactions. No financial penalties, sanctions, or restrictions were imposed, and the company completed corrective steps reviewed and accepted by the Audit & Risk Management Committee and the Board.
Enforcement Directorate Search: The Enforcement Directorate (ED) conducted a search and seizure operation under the Foreign Exchange Management Act (FEMA), 1999, at company premises between June 1 and June 3, 2026. The company provided requested documents and records, extending cooperation. No further communication has been received from the agency as of the filing date.
Management Leadership Transition
In addition to approving the Q1 FY27 financial results, the Board announced a leadership transition. Amarendu Prakash, former Chairman and Managing Director of Steel Authority of India Limited (SAIL), has been appointed as CEO-Designate, effective August 1, 2026. He succeeds outgoing CEO Arun Misra.
Business Expansion & Growth Projects
Hindustan Zinc is advancing growth initiatives aimed at expanding refined metal and silver capacity:
Debari Zinc Smelter: Site mobilization and engineering are underway for a 250 KTPA integrated zinc smelter at Debari, Rajasthan, as part of long-term plans to consolidate a 1 MTPA smelting complex at one location.
Resource Exploration: Exploration programs continue across the Zawar and Rajpura Dariba mining blocks to expand mine life and sustain ore grade continuity.
Technology Adoption: Deployment of Hot Acid Leaching processes aims to optimize by-product recovery rates for silver and minor metals.
Value-Added Products (VAP): The company plans to raise its VAP output share toward 50%, capturing premium pricing of $50–$60 per ton in domestic industrial sectors.
Future Growth Drivers & Macro Opportunities
Global Energy Transition: Zinc plays a critical role in corrosion protection for solar structural mounting frames, offshore wind turbines, and electric vehicle (EV) chassis galvanization.
Industrial Silver Demand: Expanding demand across photovoltaic solar cells, electronics, power grid distribution infrastructure, and automotive electrification supports silver realizations.
Domestic Infrastructure Spending: Government investments in railways, highway bridges, transmission towers, and urban infrastructure support domestic galvanizing zinc demand.
Business Risks & Sensitivity Analysis
Commodity Price Volatility: Operating results are sensitive to London Metal Exchange (LME) zinc and lead benchmark prices and international spot silver prices.
Regulatory & Tax Exposure: Adjustments in state mining royalties, environmental cesses, or export tariffs can impact net realizations.
Input Energy Costs: Fluctuations in imported coal prices or domestic grid power tariffs present cost structure risks, though rising renewable energy penetration helps hedge exposure.
Peer Comparison Table
| Parameter | Hindustan Zinc | Hindalco | NALCO | NMDC | Tata Steel |
| Primary Metal Focus | Zinc, Lead, Silver | Aluminium, Copper | Aluminium | Iron Ore | Steel |
| EBIT Margin (%) | 52% | ~18 – 22% | ~28 – 32% | ~40 – 45% | ~14 – 18% |
| Net Profit Margin (%) | 40% | ~8 – 12% | ~18 – 22% | ~28 – 32% | ~4 – 8% |
| Debt-to-Equity Ratio | 0.31 | ~0.50 | ~0.05 | ~0.02 | ~0.75 |
| Interest Coverage (x) | 53.02 | ~8.5x | ~35.0x | ~40.0x | ~4.5x |
SWOT Analysis
┌─────────────────────────────────────────┬─────────────────────────────────────────┐
│ STRENGTHS                               │ WEAKNESSES                              │
├─────────────────────────────────────────┼─────────────────────────────────────────┤
│ • World's lowest-cost zinc producer     │ • Revenue sensitivity to LME metal price│
│   ($851/MT COP ex-royalty).     │   cycles and silver spot markets.  │
│ • Strong balance sheet with debt-equity │ • Concentration of core mining assets   │
│   at 0.31.               │   primarily in Rajasthan, India.  │
├─────────────────────────────────────────┼─────────────────────────────────────────┤
│ OPPORTUNITIES                           │ THREATS                                 │
├─────────────────────────────────────────┼─────────────────────────────────────────┤
│ • Silver demand from solar PVs and EVs  │ • Fluctuations in global coal and energy│
│   and renewable grid integration.│   input prices.             │
│ • Greenfield/Brownfield expansions      │ • Statutory royalty rate increases or   │
│   like the Debari 250 KTPA smelter.│   mining policy changes.         │
└─────────────────────────────────────────┴─────────────────────────────────────────┘
Investment Thesis
Bull Case
Silver realizations provide strong profit contributions while core mined metal output expands.
Deleveraging improves cash flow flexibility for growth projects and shareholder dividends.
Cost control keeps zinc COP among global industry benchmarks ($851/MT).
Bear Case
Sharp corrections in international silver or LME base metal pricing would compress margins.
Delays in commissioning Debari expansion projects could cap volume upside.
Neutral / Base Case
Hindustan Zinc maintains cost leadership and structural advantages across its integrated mining assets. Earnings trajectory will continue to reflect global non-ferrous metal cycles and renewable energy transitions.
Key Ratios
| Financial Ratio | Q1 FY27 Value | Calculation Basis / Notes |
| Operating Margin (EBIT %) | 52% | EBIT / Total Revenue from Operations |
| Net Profit Margin (%) | 40% | PAT / Total Revenue from Operations |
| Debt Service Coverage Ratio | 7.44x | EBITDA / (Interest + Scheduled Principal) |
| Interest Service Coverage Ratio | 53.02x | EBITDA / Total Finance Cost |
| Debt-Equity Ratio | 0.31x | Total Debt / Total Net Worth |
| Current Ratio | 2.03x | Current Assets / Current Liabilities |
| Total Debt to Assets | 0.17x | Total Debt / Total Assets |
| Basic Earnings Per Share (EPS) | ₹12.94 | Net Profit / Total Paid-up Equity Shares |
Frequently Asked Questions
1. What was Hindustan Zinc’s consolidated net profit for Q1 FY27?
Hindustan Zinc reported a consolidated net profit (PAT) of ₹5,469 crore for Q1 FY27, representing a 144.80% YoY increase compared to ₹2,234 crore in Q1 FY26.
2. How much revenue did Hindustan Zinc generate in Q1 FY27?
Consolidated revenue from operations reached ₹13,747 crore, growing 76.90% YoY from ₹7,771 crore in Q1 FY26.
3. What drove the surge in Hindustan Zinc’s Q1 FY27 profits?
Profit growth was driven by a surge in silver segment revenues (up 169.21% YoY to ₹3,839 crore), operational debottlenecking, and a drop in zinc production costs to $851/MT.
4. What was the zinc cost of production in Q1 FY27?
Zinc cost of production (excluding royalty) dropped to $851 per metric ton, down 16% YoY and 6% QoQ.
5. What was Hindustan Zinc’s mined metal production volume?
Mined metal production reached 268 kilotonnes (KT) in Q1 FY27, up 1% YoY, marking the highest first-quarter output for the fifth consecutive year.
6. What was the refined zinc and lead production in Q1 FY27?
Refined zinc production stood at 213 KT (+6% YoY), while refined lead output reached 47 KT (-2% YoY).
7. What was the contribution of the silver segment to revenue?
Silver segment revenue reached ₹3,839 crore, accounting for approximately 28% of total consolidated operational revenue.
8. Did Hindustan Zinc declare a dividend during the quarter?
The Board declared an interim dividend of ₹11 per share (totaling ₹4,648 crore) on April 24, 2026, with a record date of April 30, 2026.
9. What is Hindustan Zinc’s current Debt-to-Equity ratio?
The consolidated debt-to-equity ratio improved to 0.31 as of June 30, 2026, down from 1.19 as of June 30, 2025.
10. What did the filing report regarding regulatory communications?
The company disclosed that SEBI issued observations regarding related-party transaction procedures, which brought no financial penalties. Corrective steps were implemented and accepted by the Board.
11. What was disclosed regarding the Enforcement Directorate (ED) search?
The company confirmed that the ED conducted a search under FEMA between June 1 and June 3, 2026. Full cooperation and requested records were provided, with no further communication received since.
12. Who was appointed as the new CEO-Designate?
Amarendu Prakash, former CMD of SAIL, was appointed CEO-Designate effective August 1, 2026, succeeding Arun Misra.
13. What is Hindustan Zinc’s operating margin for Q1 FY27?
The company’s EBIT operating margin expanded to 52%, up from 38% in Q1 FY26 and 49% in Q4 FY26[cite: 4].
14. What are the key ongoing capital expenditure plans?
Key projects include site mobilization for a 250 KTPA integrated zinc smelter at Debari, Rajasthan, and exploration across the Zawar and Rajpura Dariba mining blocks.
15. What was basic earnings per share (EPS) for Q1 FY27?
Consolidated basic EPS for the quarter was ₹12.94 per share of face value ₹2 each[cite: 4].
Final Verdict
Hindustan Zinc’s Q1 FY27 financial results reflect top-line growth, margin expansion, and balance sheet deleveraging[cite: 4]. The combination of lower operating cost structures ($851/MT COP) and silver realizations pushed net profit to ₹5,469 crore. As the company progresses with its capacity expansion projects at Debari, commodity price movements will remain a key factor for future earnings performance.
Investors should evaluate their own financial objectives, risk tolerance, and consult a qualified financial advisor before making investment decisions.



