

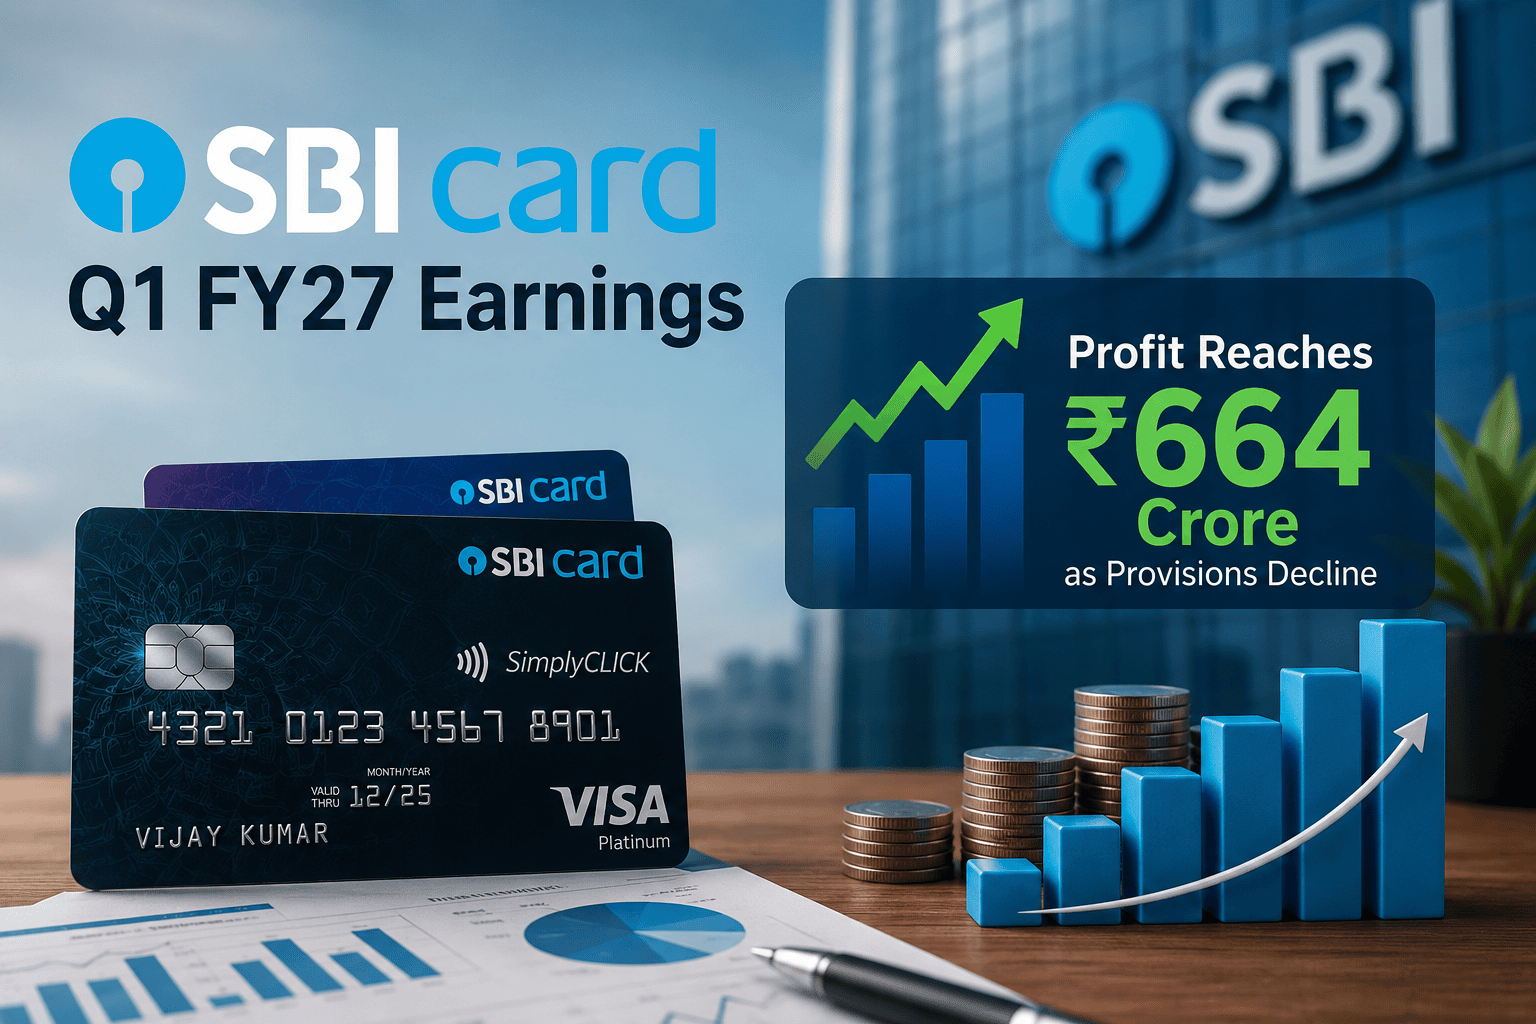
SBI Cards and Payment Services Ltd. (SBICARD) reported its financial results for the first quarter of FY27 (quarter ended June 30, 2026), posting a 19.51% year-on-year (YoY) increase in Profit After Tax (PAT) at ₹664.44 crore compared to ₹555.96 crore in Q1 FY26. Revenue from operations rose 3.36% YoY to ₹5,040.55 crore, while total income reached ₹5,205.38 crore. The quarterly performance was supported by sequential and annual improvements in asset quality, as Gross Non-Performing Assets (GNPA) declined to 2.04%.
Executive Summary
SBI Cards and Payment Services Limited, India’s pure-play credit card issuer, disclosed its financial results for Q1 FY27 following its Board of Directors meeting on July 24, 2026. The company delivered double-digit YoY net profit growth, supported by easing credit costs and lower provisioning requirements. Impairment on financial instruments dropped 29.88% YoY to ₹947.68 crore from ₹1,351.55 crore in Q1 FY26.
The quarter reflected stable top-line performance across fees and commission income, which grew 9.78% YoY to ₹2,405.54 crore. Interest income stood at ₹2,420.63 crore. SBI Cards maintained an optimal capital position with a Capital Adequacy Ratio (CRAR) of 25.64%, comfortably exceeding the Reserve Bank of India’s (RBI) regulatory requirement.
Key Highlights
Profit After Tax (PAT): ₹664.44 crore, up 19.51% YoY (₹555.96 crore in Q1 FY26) and up 9.05% QoQ (₹609.30 crore in Q4 FY26).
Revenue from Operations: ₹5,040.55 crore, compared to ₹4,876.92 crore in Q1 FY26 (+3.36% YoY).
Total Income: ₹5,205.38 crore (+3.38% YoY).
Fees & Commission Income: ₹2,405.54 crore, growing 9.78% YoY.
Impairment Losses (Credit Cost): Reduced to ₹947.68 crore (-29.88% YoY and -5.87% QoQ).
Asset Quality: GNPA improved to 2.04% (vs 2.41% in Q4 FY26); Net NPA improved to 0.83% (vs 1.04% in Q4 FY26).
Capital Adequacy Ratio: Healthy at 25.64%.
Net Profit Margin: Stood at 12.76% for the quarter.
Financial Performance Snapshot
+-------------------------------------------------------------------------+
|                  SBI CARDS Q1 FY27 FINANCIAL SNAPSHOT                   |
|                                                                         |
|  PROFIT AFTER TAX (PAT)                                                 |
|  Q1 FY26:  [₹555.96 Cr]                                                 |
|  Q4 FY26:  [₹609.30 Cr]                                                 |
|  Q1 FY27:  [=========================> ₹664.44 Cr (+19.51% YoY)]        |
|                                                                         |
|  IMPAIRMENT ON FINANCIAL INSTRUMENTS (PROVISIONS)                       |
|  Q1 FY26:  [=========================> ₹1,351.55 Cr]                   |
|  Q4 FY26:  [=================> ₹1,006.82 Cr]                            |
|  Q1 FY27:  [===============> ₹947.68 Cr (-29.88% YoY)]                  |
+-------------------------------------------------------------------------+
Table 1: Quarterly Financial Highlights (₹ in Crores)
| Metric | Q1 FY27 (Unaudited) | Q4 FY26 (Audited) | Q1 FY26 (Unaudited) | YoY Growth (%) | QoQ Growth (%) |
| Interest Income | 2,420.63 | 2,381.76 | 2,493.15 | -2.91% | +1.63% |
| Fees & Commission Income | 2,405.54 | 2,342.98 | 2,191.15 | +9.78% | +2.67% |
| Business Dev. Incentive | 204.08 | 203.17 | 166.58 | +22.51% | +0.45% |
| Revenue from Operations | 5,040.55 | 4,934.50 | 4,876.92 | +3.36% | +2.15% |
| Total Income | 5,205.38 | 5,187.04 | 5,035.38 | +3.38% | +0.35% |
| Finance Costs | 744.53 | 713.02 | 812.62 | -8.38% | +4.42% |
| Fees & Commission Expenses | 396.90 | 409.44 | 187.49 | +111.69% | -3.06% |
| Impairment Losses | 947.68 | 1,006.82 | 1,351.55 | -29.88% | -5.87% |
| Operating & Other Expenses | 1,985.84 | 1,961.32 | 1,738.77 | +14.21% | +1.25% |
| Total Expenses | 4,312.23 | 4,371.13 | 4,287.03 | +0.59% | -1.35% |
| Profit Before Tax (PBT) | 893.13 | 815.91 | 748.38 | +19.34% | +9.46% |
| Profit After Tax (PAT) | 664.44 | 609.30 | 555.96 | +19.51% | +9.05% |
| Basic EPS (₹) | 6.98 | 6.40 | 5.84 | +19.52% | +9.06% |
Revenue & Cost Drivers
Revenue Breakdown
Revenue from operations reached ₹5,040.55 crore in Q1 FY27, compared to ₹4,876.92 crore in Q1 FY26.
Fees & Commissions: Fee-based revenues grew 9.78% YoY to ₹2,405.54 crore, driven by card spend volume.
Interest Income: Interest earnings were ₹2,420.63 crore.
Business Development Incentives: Income under this segment expanded 22.51% YoY to ₹204.08 crore.
+-------------------------------------------------------------------------+
|                      REVENUE DYNAMICS (Q1 FY27)                         |
|                                                                         |
|  Interest Income:              [====================] ₹2,420.63 Cr      |
|  Fees & Commission Income:     [====================] ₹2,405.54 Cr      |
|  Business Dev. Incentives:     [==] ₹204.08 Cr                          |
|  Other Income:                 [==] ₹164.81 Cr                          |
+-------------------------------------------------------------------------+
Expense Structure & Provisions
Total expenses remained flat at ₹4,312.23 crore compared to ₹4,287.03 crore in Q1 FY26.
Lower Credit Costs: Impairment on financial instruments dropped to ₹947.68 crore from ₹1,351.55 crore in Q1 FY26.
Finance Costs: Interest expenses decreased 8.38% YoY to ₹744.53 crore.
Employee Expenses: Personnel costs rose to ₹205.77 crore from ₹161.42 crore in Q1 FY26. Note 10 discloses that this includes a ₹27 crore provision for past service costs following the notification of the New Labour Codes.
Expected Credit Loss (ECL) Revision: As per Note 11, the company revised its ECL model parameters (Loss Given Default, Credit Conversion Factor, and ECL Discounting), leading to an estimated increase in overall impairment provisions of ₹100 crore. Additionally, SBI Cards is holding a prudent additional management overlay of ₹70 crore over the ECL model.
Asset Quality & Balance Sheet Metrics
SBI Cards reported sequential and YoY improvements in credit metrics:
Gross NPA (Stage 3 Ratio): Stood at 2.04% as of June 30, 2026, improving from 2.41% as of March 31, 2026.
Net NPA (Stage 3 Ratio): Decreased to 0.83% from 1.04% in the previous quarter.
Provision Coverage Ratio (PCR): Stood at 59.88%. Total expected credit loss provisions held on loan balances amounted to ₹1,870.55 crore.
Table 2: Balance Sheet & Regulatory Ratios
| Financial & Capital Metric | Value (Q1 FY27) | Notes / Comparison |
| Gross NPA Ratio | 2.04% | Improved from 2.41% as of March 31, 2026 |
| Net NPA Ratio | 0.83% | Improved from 1.04% as of March 31, 2026 |
| Provision Coverage Ratio (PCR) | 59.88% | Stage 3 coverage |
| Capital Adequacy Ratio (CRAR) | 25.64% | Well above mandatory minimum requirement |
| Debt Equity Ratio | 2.87 | Total Debt over Net Worth |
| Total Debts to Total Assets | 0.68 | Ratio of leverage to total asset base |
| Net Worth | ₹16,462.68 Cr | As of June 30, 2026 |
| Paid-up Equity Share Capital | ₹951.61 Cr | Face value ₹10 per share |
Peer Comparison
The following table compares key financial ratios across leading credit card issuers in the Indian financial sector:
Table 3: Peer Comparison Matrix
| Metric | SBI Cards | HDFC Bank Cards | ICICI Bank Cards | Axis Bank Cards |
| Capital Adequacy (CRAR) | 25.64% | ~19.5% | ~16.8% | ~16.5% |
| Gross NPA (%) | 2.04% | ~1.4% | ~1.6% | ~1.8% |
| Net NPA (%) | 0.83% | ~0.4% | ~0.5% | ~0.6% |
| Net Profit Margin (%) | 12.76% | ~15.2% | ~14.5% | ~12.0% |
SWOT Analysis
Table 4: SWOT Matrix
| Strategic Dimension | Observations |
| Strengths | • India’s pure-play credit card entity with brand backing from State Bank of India. • Strong Capital Adequacy Ratio of 25.64%. • Expanding fee revenue stream (+9.78% YoY). |
| Weaknesses | • Higher unsecured lending exposure relative to universal banks. • Elevated cost of funds compared to deposit-taking commercial banks. |
| Opportunities | • Industry shift toward digital transactions and UPI-credit integration. • Growth potential in Tier-2 and Tier-3 Indian cities for new card acquisition. |
| Threats | • Regulatory updates regarding unsecured lending risk weights. • Macroeconomic volatility impacting consumer credit default rates. |
Frequently Asked Questions
1. What was SBI Cards’ net profit in Q1 FY27?
SBI Cards recorded a Profit After Tax (PAT) of ₹664.44 crore in Q1 FY27, up 19.51% YoY from ₹555.96 crore in Q1 FY26.
2. How did asset quality perform in Q1 FY27?
Asset quality improved sequentially. Gross NPA dropped to 2.04% (from 2.41% in Q4 FY26), while Net NPA declined to 0.83% (from 1.04% in Q4 FY26).
3. What was the total revenue from operations for the quarter?
Revenue from operations reached ₹5,040.55 crore in Q1 FY27, representing a 3.36% increase over ₹4,876.92 crore in Q1 FY26.
4. How much did SBI Cards allocate for impairment/credit costs?
Impairment on financial instruments stood at ₹947.68 crore, down 29.88% YoY compared to ₹1,351.55 crore in Q1 FY26.
5. What is SBI Cards’ Capital Adequacy Ratio?
The company maintained a Capital Adequacy Ratio of 25.64% as of June 30, 2026.
6. Did the New Labour Codes impact employee costs in Q1 FY27?
Yes, employee expenses included a ₹27 crore provision for past service costs following the notification of the New Labour Codes rules.
7. What changes were made to the Expected Credit Loss (ECL) model?
SBI Cards revised its ECL model (Loss Given Default, CCF, and ECL Discounting), increasing impairment provisions by ₹100 crore, while maintaining an additional management overlay of ₹70 crore.
8. What was the Net Profit Margin for the quarter?
The Net Profit Margin (PAT / Total Income) stood at 12.76% for Q1 FY27.
9. What is the share capital of SBI Cards as of June 30, 2026?
Paid-up equity share capital stood at ₹951.61 crore (comprising shares of face value ₹10 each).
10. Who audited the Q1 FY27 results?
The limited review report was issued jointly by V.K. Dhingra & Co. and S.P. Chopra & Co., Chartered Accountants.
Conclusion
SBI Cards & Payment Services Ltd.’s Q1 FY27 financial results show higher net profits supported by reduced provisioning costs and improving asset quality. The reduction in Gross NPA to 2.04%, alongside fee income growth and a capital adequacy ratio of 25.64%, outlines the company’s financial metrics for the quarter. Investors will continue to monitor card spend growth and credit costs in upcoming quarters.
Disclaimer
This article is for informational purposes only and does not constitute financial or investment advice. Readers are advised to consult a certified financial advisor before making investment decisions.



