

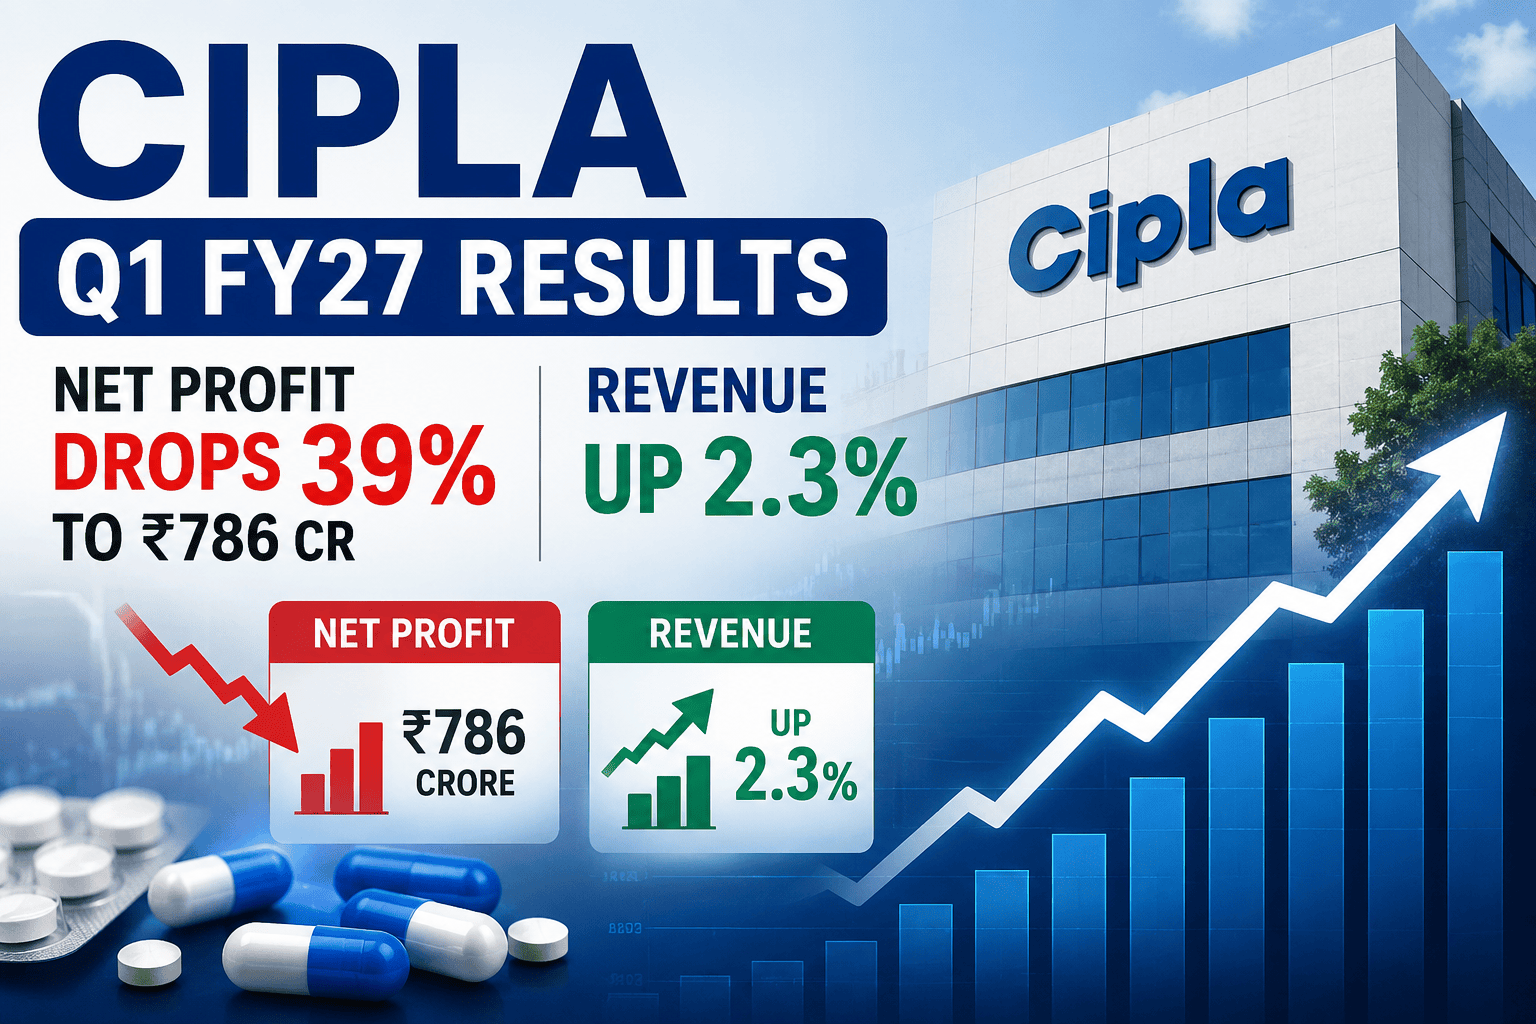
In a quarter characterized by severe cross-winds in overseas generic markets alongside steady domestic expansion, pharma major Cipla Ltd. reported its Q1 FY27 financial results on July 23, 2026. While consolidated revenue from operations showed resilience—rising 2.33% YoY to ₹7,119.28 crore—profitability faced significant pressure. Consolidated net profit for the quarter plummeted 39.18% YoY to ₹785.55 crore (from ₹1,291.61 crore in Q1 FY26), severely impacted by heightened price erosion, shifts in product mix within the US generic portfolio (particularly post-exclusivity normalization for generic Revlimid), and elevated raw material trade adjustments.
Equally striking was the operational performance contraction: EBITDA dropped 32.96% YoY to ₹1,192 crore, dragging operating margins down by nearly 900 basis points to 16.74%. Investors reacted promptly during the trading session on July 23, 2026, sending Cipla shares down by 3.06% to close at ₹1,371.80 on the NSE, hitting an intraday low of ₹1,366.10.
For retail and long-term investors, Q1 FY27 offers a crucial reality check: while Cipla’s core “One India” prescription and consumer health engines continue to post strong momentum, margin headwinds in key export geographies present near-term hurdles.
Executive Summary
Revenue Growth: Consolidated revenue from operations stood at ₹7,119.28 crore, up 2.33% YoY and 8.84% QoQ.
Profitability Compression: Consolidated Net Profit (PAT) declined 39.18% YoY to ₹785.55 crore, though it rebounded 44.80% sequentially from ₹542.51 crore in Q4 FY26.
EBITDA Decline: Operating profit (EBITDA) fell 32.96% YoY to ₹1,192 crore, compared to ₹1,778 crore in Q1 FY26.
Margin Contraction: EBITDA margin compressed sharply to 16.74% from 25.55% in the corresponding quarter last year.
EPS Impact: Basic Diluted EPS stood at ₹9.76 for the quarter, compared to ₹16.06 in Q1 FY26.
US Market Drag: The North American business saw growth headwinds due to increased competitive intensity and lower contribution from key generic assets.
India Business Support: The “One India” domestic prescription and consumer health divisions delivered steady organic growth.
Other Income: Other income fell 18.43% YoY to ₹210.90 crore.
Tax Expenses: Total net tax expense dropped to ₹294.83 crore in line with lower profit before tax.
Capital Position: The balance sheet remains fundamentally robust with minimal long-term debt and strong cash liquidity.
DPCO Contingency: The company maintains a legal defense regarding pending DPCO demand notices totaling ₹2,011 crore (including interest) with no provision made based on legal opinion.
New Labour Code: The previously recorded exceptional gratuity and leave liability of ₹275.91 crore in FY26 was non-recurring, leaving Q1 FY27 clear of exceptional losses.
Key Numbers at a Glance
The following table summarizes the consolidated financial performance of Cipla Ltd. for the quarter ended June 30, 2026 (Q1 FY27) compared with previous periods.
| Metric (in ₹ Crores, except EPS) | Q1 FY27 (Unaudited) | Q4 FY26 (Audited) | Q1 FY26 (Unaudited) | YoY Growth (%) | QoQ Growth (%) |
Revenue from Sale of Products | ₹7,077.02 | ₹6,464.26 | ₹6,837.04 | +3.51% | +9.48% |
Other Operating Revenue | ₹42.26 | ₹76.94 | ₹120.43 | -64.91% | -45.07% |
Total Revenue from Operations | ₹7,119.28 | ₹6,541.20 | ₹6,957.47 | +2.33% | +8.84% |
Other Income | ₹210.90 | ₹148.16 | ₹258.56 | -18.43% | +42.35% |
Total Income | ₹7,330.18 | ₹6,689.36 | ₹7,216.03 | +1.58% | +9.58% |
Total Expenses | ₹6,248.25 | ₹5,982.30 | ₹5,446.10 | +14.73% | +4.45% |
| Operating Profit (EBITDA) | ₹1,192.00 | ₹955.00 | ₹1,778.00 | -32.96% | +24.82% |
| EBITDA Margin (%) | 16.74% | 14.60% | 25.55% | -881 bps | +214 bps |
Finance Costs | ₹17.03 | ₹13.13 | ₹14.05 | +21.21% | +29.70% |
Depreciation & Amortization | ₹304.24 | ₹382.92 | ₹252.72 | +20.39% | -20.55% |
Profit Before Tax (PBT) | ₹1,081.93 | ₹707.06 | ₹1,769.93 | -38.87% | +53.02% |
Tax Expense (Net) | ₹294.83 | ₹156.95 | ₹477.88 | -38.30% | +87.86% |
Net Profit (PAT) | ₹785.55 | ₹542.51 | ₹1,291.61 | -39.18% | +44.80% |
PAT Attributable to Parent | ₹789.05 | ₹554.64 | ₹1,297.62 | -39.19% | +42.26% |
Basic & Diluted EPS (₹) | ₹9.76 | ₹6.86 | ₹16.06 | -39.23% | +42.27% |
Stock Market Reaction
The Indian equity markets reacted with noticeable caution to Cipla’s Q1 FY27 earnings release on July 23, 2026.
Opening Price: Opened slightly weak at ₹1,409.10 on the NSE, compared to the previous close of ₹1,415.10.
Intraday Action: After touching a morning high of ₹1,426.90, selling pressure intensified post 12:00 PM as operational margin details filtered through. The stock hit an intraday low of ₹1,366.10.
Closing Price: Ended the session at ₹1,371.80, marking a decline of ₹43.30 (-3.06%).
Volume: Trading volume surged to 4.25 million shares on the NSE, significantly higher than the 30-day average trading volume.
Market Sentiment: Sentiment turned cautious as analysts highlighted that while revenue met street forecasts, EBITDA and PAT fell short of baseline market estimates due to gross margin compression.
Cipla Intraday Price Trajectory (July 23, 2026)
1,430 |-----\
1,410 |      \----- (Earnings Released)
1,390 |            \
1,370 |             \--------\ (Closed: ₹1,371.80)
1,350 +---------------------------------
     09:15 AM    12:30 PM    03:30 PM
5. Financial Performance Analysis
Revenue & Top-Line Structure
Consolidated revenue from operations grew 2.33% YoY to ₹7,119.28 crore. A key change in financial presentation effective April 1, 2026, involves reclassifying certain sales promotion expenditures directly as a deduction from Revenue from Operations rather than including them under “Other Expenses”. In previous periods, these expenditures amounted to ₹115.24 crore in Q1 FY26 and ₹145.13 crore in Q4 FY26. This accounting adjustment is purely neutral to net profit, EPS, and cash flows.
Expenses & Cost Dynamics
Raw Material & Inventory: Raw material costs plus changes in inventories totaled ₹2,667.18 crore in Q1 FY27, compared to ₹2,170.71 crore in Q1 FY26. Elevated stock-in-trade purchases (₹1,251.70 crore vs ₹1,025.02 crore) reflected higher trade sourcing costs.
Employee Expenses: Staff costs rose 14.11% YoY to ₹1,497.41 crore, driven by annual increments and workforce expansion in domestic field forces.
Other Expenses: Other expenses stood at ₹1,762.39 crore, up 3.90% YoY.
Cost Composition - Q1 FY27 (Total Expenses: ₹6,248.25 Cr)
┌─────────────────────────────────┬──────────┐
│ Expense Head                    │ Share %  │
├─────────────────────────────────┼──────────┤
│ Raw Materials & Purchases       │ 42.68%   │
│ Other Expenses                  │ 28.21%   │
│ Employee Benefits               │ 23.96%   │
│ Depreciation & Amortization     │  4.87%   │
│ Finance Costs                   │  0.27%   │
└─────────────────────────────────┴──────────┘
Capital Structure & Cash Position
Cipla continues to hold a fortress balance sheet:
Debt: Minimal financial debt (Consolidated debt-to-equity ratio near zero). Finance costs remained nominal at ₹17.03 crore.
Liquidity: Cash, bank balances, and liquid investments provide sufficient strategic flexibility for inorganic expansions and R&D pipelines.
Segment-wise Analysis
In compliance with Ind AS 108, Cipla operates and evaluates performance as a single reportable segment: Pharmaceuticals and Related Products. However, geographic geographic disclosures reveal key trends:
Geographic Revenue Breakdown (Q1 FY27 Est.)
┌─────────────────────────┬──────────────┐
│ Region                  │ Share (%)    │
├─────────────────────────┼──────────────┤
│ One India               │ ~48%         │
│ North America (US)      │ ~27%         │
│ South Africa & SADC     │ ~12%         │
│ International / RoW     │ ~13%         │
└─────────────────────────┴──────────────┘
1. One India (Domestic Formulation & Consumer Health)
Performance: Continued its steady trajectory, propelled by chronic therapies (Respiratory, Cardiology, Diabetes) and strong traction in Cipla Health brands.
Growth Drivers: Volume expansion in core brands, coupled with wider distribution in Tier-2 to Tier-4 cities through deep trade partnerships.
2. North America (US Business)
Performance: Faced top-line headwinds as generic competition in mature respiratory assets and market share erosion in key complex generics weighed on realizations.
Outlook: Focused on advancing complex generic filings (peptide injectables, inhalation products, and ANDAs) to offset price erosion in legacy portfolios.
3. South Africa, Sub-Saharan Africa & Global Access (SADC)
Performance: Delivered stable growth backed by prescription sales and strong tender wins in public healthcare sectors.
4. International Markets & Emerging Markets
Performance: Steady execution across European and Rest of World (RoW) markets helped buffer against competitive volatility in North America.
Management Commentary
During the post-earnings communications led by Managing Director and Global CEO Achin Gupta, management highlighted the strategic direction:
Executive Viewpoint: “Our Q1 FY27 performance demonstrates robust structural core execution in our domestic prescription and consumer healthcare portfolios, even as competitive pricing pressures in the US generic landscape created margin pushback. We remain steadfast in advancing our key pipelines in complex generics, peptide formulations, and respiratory assets.”
Strategic Priorities:
R&D Allocation: R&D expenditure remains focused on peptide platform developments, respiratory inhalers, and complex injectables.
Capital Expenditure: Ongoing capex programs targeted at upgrading manufacturing facilities to meet global regulatory requirements and expanding API capacity.
Domestic Consolidation: The pending merger of wholly owned subsidiary Inzpera Healthsciences Limited into Cipla Limited (currently awaiting final NCLT Mumbai approval) will further streamline domestic operational structures.
Why Did Results Change?
    [ YoY Margin Drivers ]

    (+) Domestic Volume Growth & Consumer Health Scale
    (-) US Price Erosion & Revlimid Off-Peak
    (-) Higher Raw Material Sourcing Costs
    (-) Increased Employee Compensation Costs
    ---------------------------------------------------
    (=) EBITDA Margin Compressed from 25.55% to 16.74%
US Exclusivity Normalization: Normalization of market dynamics for generic Revlimid directly affected high-margin contribution from the North American geography.
Cost Sourcing Adjustments: A rise in stock-in-trade purchases and raw material inputs squeezed gross margins.
Employee Overhead: Staffing additions and talent retention efforts pushed employee expenses up by 14.11% YoY.
Accounting Presentation Shift: Deduction of promotional expenses directly from top-line lowered reported gross revenues without impacting bottom-line numbers.
Industry Analysis
The Indian Pharmaceutical Industry (IPI) faces a shifting dual environment:
┌─────────────────────────────────┬─────────────────────────────────┐
│ Tailwinds                       │ Headwinds                       │
├─────────────────────────────────┼─────────────────────────────────┤
│ • Strong chronic demand in India│ • US Price Erosion (~6-8% p.a.) │
│ • Expansion in OTC/Wellness     │ • Heightened USFDA Inspection   │
│ • Shift to Complex Peptides     │ • Input Material Volatility     │
└─────────────────────────────────┴─────────────────────────────────┘
Peer Valuation & Performance Comparison:
| Company | Market Cap (₹ Cr) | TTM P/E | Operating Margin (%) | TTM ROE (%) |
| Cipla Ltd. | ₹1,12,593 | 30.0x | 16.7% | 11.6% |
| Sun Pharma | ₹4,66,131 | 37.5x | 27.1% | 13.6% |
| Torrent Pharma | ₹1,70,419 | 77.8x | 31.5% | 20.6% |
| Divi’s Labs | ₹1,96,087 | 74.8x | 28.3% | 13.4% |
Valuation Analysis
At the closing price of ₹1,371.80, Cipla trades at a Trailing Twelve Month (TTM) P/E ratio of ~30.0x and a Price-to-Book ratio of ~3.2x based on book value.
Historical Averages: The current forward P/E aligns close to Cipla’s 5-year historical median valuation of ~27x–31x.
DCF Considerations: Assuming a 10% long-term revenue CAGR driven by domestic formulations and a terminal growth rate of 4.5%, current market prices reflect stable expectations for pipeline launches in FY28.
Note: This valuation analysis is for educational and analytical purposes only and does not constitute individual financial or investment advice.
Analyst View
Street views following the Q1 FY27 release reflect a split consensus across major domestic and global brokerages:
Bull Case Scenario:
Strong “One India” prescription dominance generates predictable, cash-flow-heavy operational delivery.
Accelerated complex generic approvals (gAdvair, gAbraxane, peptide filings) in H2 FY27/FY28 provide strong top-line upside.
Robust balance sheet protection with minimal financial leverage.
Bear Case Scenario:
Prolonged price erosion in North America suppresses consolidated margins.
Potential regulatory compliance delays at key manufacturing facilities could delay complex launches.
Overhanging statutory demand contingencies regarding DPCO pricing notices.
SWOT Analysis
                       SWOT ANALYSIS - CIPLA LTD.
 ┌──────────────────────────────────┬──────────────────────────────────┐
 │ STRENGTHS                        │ WEAKNESSES                       │
 │ • Domestic market leader in      │ • Exposure to US generic price   │
 │   Respiratory & Chronic care│   erosion & concentration │
 │ • Debt-free balance sheet     │ • Slower margin recovery in key  │
 │ • Deep pan-India distribution    │   export markets       │
 ├──────────────────────────────────┼──────────────────────────────────┤
 │ OPPORTUNITIES                    │ THREATS                          │
 │ • Expansion of Cipla Health (OTC)│ • Regulatory scrutiny (USFDA)    │
 │ • Peptide & Complex Injectables  │ • Pending DPCO litigation        │
 │ • Inzpera integration synergies│   claims of ₹2,011 Crore   │
 └──────────────────────────────────┴──────────────────────────────────┘
Risk Factors
Regulatory Inspections: Compliance outcomes from USFDA inspections at manufacturing plants (e.g., Goa, Pithampur) remain critical for pipeline approvals.
Pricing Controls (NLEM/DPCO): Expansion of National List of Essential Medicines (NLEM) price caps in India can restrict price hikes in chronic categories.
Pending DPCO Demands: Total NPPA demand notices aggregate to ₹2,011 crore (₹863 crore principal + ₹1,148 crore interest). While the company expects a favorable legal outcome, any adverse final Supreme Court ruling poses a contingent cash outflow risk.
Currency Volatility: FX swings across South African Rand (ZAR) and US Dollar (USD) affect consolidated revenue translation.
Opportunities
Complex Generic Inhalers & Peptides: Entering high-barrier drug delivery segments in global markets.
Consumer Healthcare (Cipla Health): Capitalizing on the rapid shift toward wellness, OTC self-care, and nutraceutical products across India.
Inzpera Healthsciences Merger: Amalgamation of Inzpera Healthsciences will optimize corporate overheads and enhance pediatric and wellness portfolios.
What Investors Should Watch
┌────────────────────────────────────────────────────────────────────────┐
│                        KEY UPCOMING MONITORABLES                       │
├────────────────────────────────────────────────────────────────────────┤
│ 1. Launch Trajectory of key complex generic pipeline filings in US     │
│ 2. EBITDA Margin Stabilization toward the 20%-22% targeted band        │
│ 3. Final NCLT Sanction on Inzpera Healthsciences Amalgamation│
│ 4. Supreme Court hearings regarding NPPA DPCO demand petitions│
└────────────────────────────────────────────────────────────────────────┘
Practical Takeaways
For Long-Term Investors
Cipla remains a core pharma candidate with strong domestic moats, a conservative balance sheet, and leadership in chronic care. Current margin pressures reflect a transition phase in US generic portfolios.
For Short-Term & Swing Traders
The stock exhibits technical support near ₹1,350–₹1,365 levels. Overhead resistance lies at ₹1,425–₹1,450. Near-term sentiment may remain muted until margin recovery is visible.
For Dividend & Value Investors
Dividend yield remains modest (~0.93%), but consistent cash generation supports dividend payouts (historically ~25%–27% payout ratio).
Conclusion
Cipla Ltd.’s Q1 FY27 financial performance highlights a clear divergence between domestic operational strength and overseas generic margin pressure. While top-line revenue moved up to ₹7,119.28 crore, a 39% YoY reduction in net profit highlights the impact of price erosion and product mix normalization in the United States. Backed by an almost debt-free balance sheet, strong domestic brand equity, and strategic investments in complex generics and consumer healthcare, Cipla remains structurally well-positioned to navigate near-term headwinds. Investors should track EBITDA margin trends and regulatory pipeline developments in upcoming quarters.



