

1. Introduction
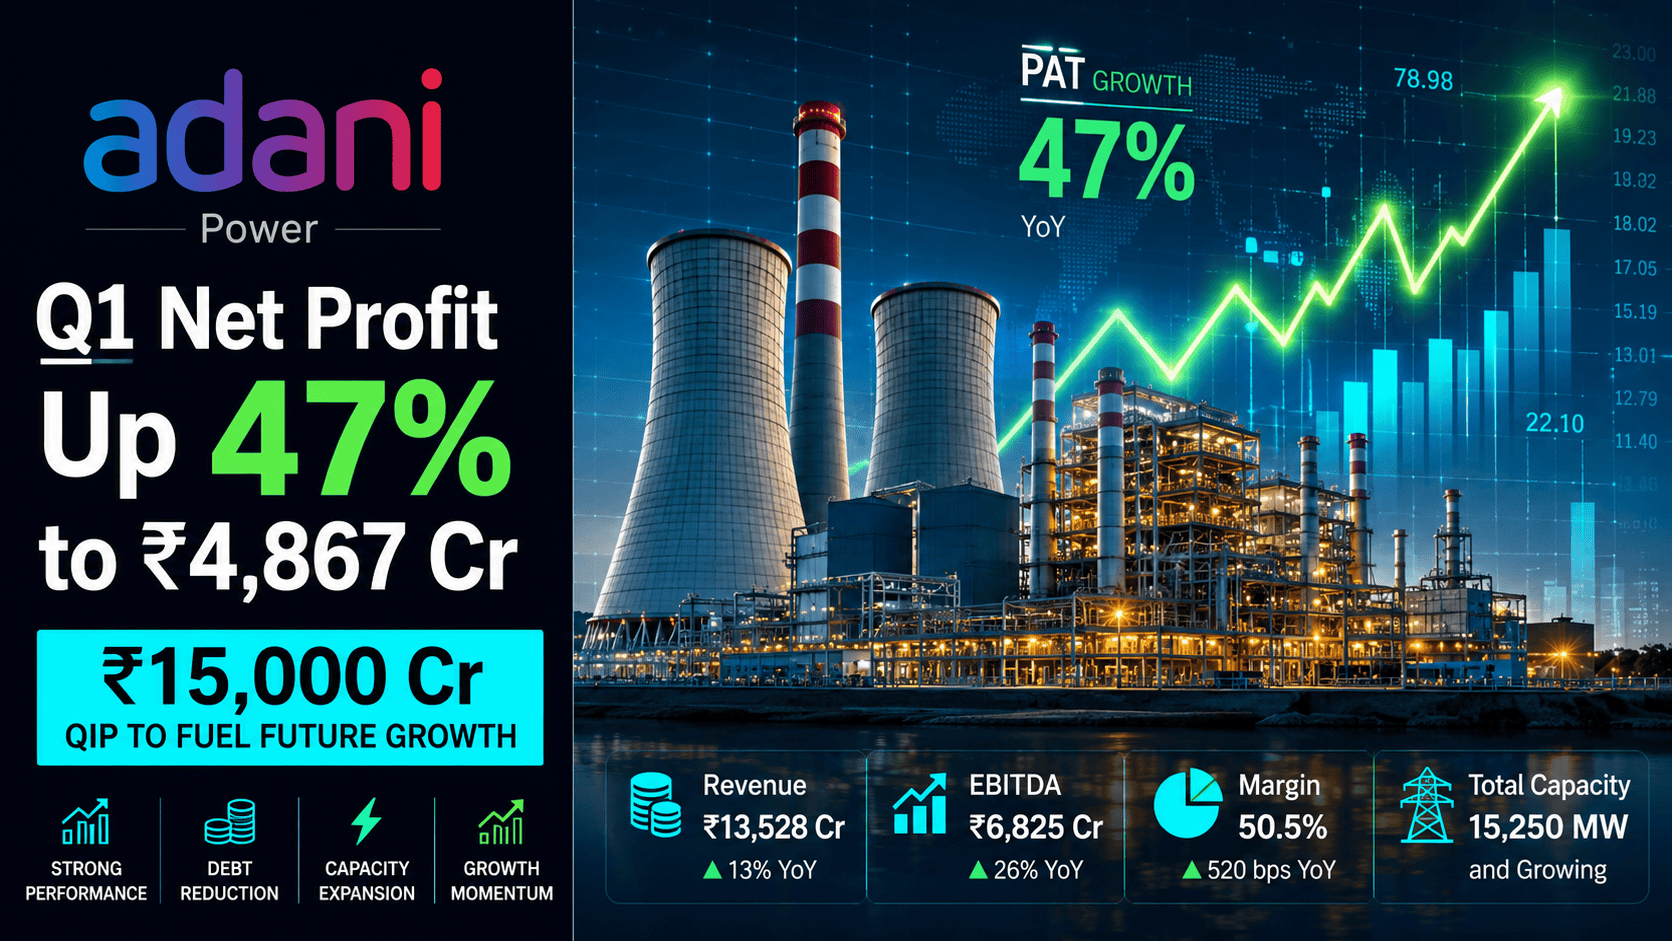
During a summer marked by record heatwaves across India, Adani Power Limited (NSE: ADANIPOWER, BSE: 533096) delivered its highest-ever quarterly operating and financial performance. On July 22, 2026, India’s largest private thermal power producer disclosed a 47.24% year-over-year (YoY) surge in consolidated Net Profit (PAT) to ₹4,866.60 crore for the first quarter ended June 30, 2026 (Q1 FY27).
Total reported revenue climbed 32.58% YoY to ₹19,322.30 crore, driven by power dispatch reaching a record 28.8 Billion Units (BU) as all-India peak demand touched an all-time high of 270.8 GW. Alongside its earnings, the Board approved a equity fund-raise of up to ₹15,000 crore via Qualified Institutions Placement (QIP) and expanded the borrowing cap from ₹75,000 crore to ₹1,00,000 crore to fund its capacity expansion target of 45 GW.
2. Executive Summary
Adani Power Limited’s Q1 FY27 performance reflects a combination of volume expansion, improved tariff realizations, and capital restructuring:
📌 8 Key Executive Highlights
Record Net Profit: Consolidated PAT rose 47.24% YoY to ₹4,866.60 crore (vs ₹3,305.13 crore in Q1 FY26).
Top-line Surge: Total reported revenue reached ₹19,322.30 crore (+32.58% YoY). Continuing revenue from operations stood at ₹17,550.43 crore (+28.08% YoY).
EBITDA Expansion: Reported EBITDA expanded 36.09% YoY to ₹8,369.09 crore. Continuing EBITDA grew 21.57% YoY to ₹6,982.75 crore.
Highest-Ever Generation: Power sales volumes grew 16.87% YoY to 28.8 BU, supported by an average Plant Load Factor (PLF) of 77.9% across plants.
₹15,000 Crore QIP Approved: The Board approved issuing equity shares/eligible securities via QIP up to ₹15,000 crore.
Borrowing Limit Expanded: Authorized borrowing limits were raised from ₹75,000 crore to ₹1,00,000 crore. EGM scheduled for August 14, 2026.
Asset Acquisition Integration: Successfully executed agreements to acquire 180 MW Churk power plant, a 24% stake in Jaiprakash Power Ventures Ltd (JPVL), and an 11.49% stake in Prayagraj Power Generation Co. Ltd.
Controlled Finance Costs: Finance costs increased by 5.19% YoY to ₹901.37 crore despite ongoing capital expenditure programs and higher asset leverage.
3. Company Snapshot
Company Name: Adani Power Limited (APL)
Corporate Identity Number (CIN): L40100GJ1996PLC030533
Incorporated / Founded: 1996
Headquarters: Adani Corporate House, Shantigram, Near Vaishno Devi Circle, S.G. Highway, Khodiyar, Ahmedabad – 382421, Gujarat
Promoter / Portfolio Group: Adani Portfolio / Gautam S. Adani (Chairman)
Chief Executive Officer: S B Khyalia
Core Business Model: Thermal power generation, power trading, coal-linked energy generation under long-term PPAs and merchant routes.
Market Position: Largest private thermal power producer in India.
Operational Installed Capacity: 18,330 MW across 13 thermal plants in Gujarat, Maharashtra, Karnataka, Rajasthan, Chhattisgarh, Madhya Pradesh, Jharkhand, Tamil Nadu, and Uttar Pradesh, plus a 40 MW solar plant.
Ticker Symbols: NSE:
ADANIPOWER| BSE:533096
4. Q1 FY27 Financial Performance
📊 Consolidated Financial Results Comparison (₹ Crore)
| Financial Metric | Q1 FY27 (Unaudited) PDF | Q4 FY26 (Audited) PDF | Q1 FY26 (Unaudited) PDF | YoY Growth (%) PDF | QoQ Growth (%) PDF | FY26 Full Year PDF |
| Revenue from Operations | ₹18,901.89 | ₹14,223.09 | ₹14,109.15 | +33.97% | +32.89% | ₹54,240.52 |
| Other Income | ₹420.41 | ₹1,766.00 | ₹464.55 | -9.50% | -76.19% | ₹3,624.76 |
| Total Reported Income | ₹19,322.30 | ₹15,989.09 | ₹14,573.70 | +32.58% | +20.85% | ₹57,865.28 |
| Continuing Operating Revenue | ₹17,550.43 | — | ₹13,702.94 | +28.08% | — | ₹53,781.45 |
| Prior Period Income Realization | ₹1,386.34 | ₹391.14 | ₹406.21 | +241.29% | +254.43% | ₹1,743.66 |
| Fuel Cost | ₹9,512.70 | ₹7,895.72 | ₹7,309.19 | +30.15% | +20.48% | ₹29,168.02 |
| Employee Expenses | ₹241.79 | ₹230.55 | ₹221.73 | +9.05% | +4.88% | ₹855.18 |
| Finance Costs | ₹901.37 | ₹967.26 | ₹856.93 | +5.19% | -6.81% | ₹3,366.83 |
| Depreciation & Amortization | ₹1,167.23 | ₹1,147.23 | ₹1,088.59 | +7.22% | +1.74% | ₹4,564.53 |
| Other Expenses | ₹1,032.77 | ₹1,101.85 | ₹768.55 | +34.38% | -6.27% | ₹3,644.13 |
| Total Expenses | ₹13,021.81 | ₹11,605.11 | ₹10,369.39 | +25.58% | +12.21% | ₹42,365.77 |
| Share of Profit from Associates | ₹117.69 | — | — | N/A | N/A | — |
| Profit Before Tax (PBT) | ₹6,418.18 | ₹4,383.98 | ₹4,204.31 | +52.66% | +46.40% | ₹15,499.51 |
| Tax Expenses | ₹1,551.58 | ₹112.58 | ₹899.18 | +72.55% | +1,278.20% | ₹2,528.43 |
| Net Profit (PAT) | ₹4,866.60 | ₹4,271.40 | ₹3,305.13 | +47.24% | +13.93% | ₹12,971.08 |
| Basic & Diluted EPS (₹) | ₹2.49 | ₹2.08 | ₹1.72 | +44.77% | +19.71% | ₹6.62 |
| Continuing EBITDA | ₹6,982.75 | — | ₹5,743.62 | +21.57% | — | ₹21,285.35 |
| Reported EBITDA | ₹8,369.09 | — | ₹6,149.83 | +36.09% | — | ₹23,430.87 |
| Operating Margin (%) | 42.12% | 34.28% | 40.30% | +182 bps | +784 bps | 37.06% |
| Net Profit Margin (%) | 25.19% | 26.71% | 22.68% | +251 bps | -152 bps | 22.42% |
💡 Did You Know?
On September 6, 2025, Adani Power split its existing equity shares from a face value of ₹10 per share to ₹2 per share. EPS numbers for previous comparative periods have been restated accordingly.
5. Segment-wise Performance & Operational Metrics
📊 Segment Revenue & Profitability (₹ Crore)
| Segment Parameter | Q1 FY27 PDF | Q4 FY26 PDF | Q1 FY26 PDF | YoY Growth (%) PDF |
| Power Generation Revenue | ₹18,901.89 | ₹14,223.09 | ₹14,109.15 | +33.97% |
| Power Generation Segment Results | ₹6,502.68 | ₹4,439.59 | ₹4,263.00 | +52.54% |
| Trading, Investment & Others | ₹37.27 | (₹0.02) | ₹13.93 | +167.55% |
| Unallocable Expenses | (₹121.77) | (₹55.59) | (₹72.62) | +67.68% |
| Total Segment Assets | ₹1,52,946.00 | ₹1,42,279.92 | ₹1,19,106.70 | +28.41% |
| Total Segment Liabilities | ₹81,554.16 | ₹75,878.00 | ₹61,854.45 | +31.85% |
Operational Volume Highlights (Q1 FY27):
Power Sales Volume: 28.8 BU (+16.87% YoY)
├── PPA Power Sales: 24.5 BU (+30.30% YoY) [Tariff: ₹5.95/kWh]
└── Merchant/Short-Term Sales: 4.3 BU (-27.10% YoY) [Tariff: ₹7.04/kWh]
Plant Load Factor (PLF): 77.9% (vs 67.0% in Q1 FY26)
Total Installed Capacity: 18,330 MW (vs 17,550 MW in Q1 FY26)
PPA Volume Growth: Sales under long-term Power Purchase Agreements (PPAs) expanded 30.3% YoY to 24.5 BU, with average PPA tariffs rising 8.5% YoY to ₹5.95/kWh.
Merchant Realization: Merchant and short-term tariffs rose 13.1% YoY to ₹7.04/kWh, driven by summer peak demand.
6. What Drove the Results?
1. Macro Power Demand Expansion
India recorded heatwaves during Q1 FY27, pushing all-India electricity consumption up 8.4% YoY to 485.4 BU. Peak power demand hit a record 270.8 GW in May 2026.
2. High Spot Market Rates
Day-Ahead Market (DAM) Clearing Prices on the Indian Energy Exchange (IEX) averaged ₹5.1/unit, an increase of 15.7% YoY. Real-Time Market (RTM) prices increased 13.8% YoY to ₹4.5/unit.
IEX Spot Market Price Trends:
Q1 FY26: ₹4.41/unit ➔ Q1 FY27: ₹5.10/unit (+15.7% YoY)
3. Capacity Additions & Asset Integration
Power sale volumes grew due to higher operating capacity, including PPA tie-ups for previously uncommitted capacities at Butibori and Mutiara (Tuticorin) plants, alongside the integration of newly acquired thermal assets.
4. Prior Period Adjustments
Reported results were supported by ₹1,386.34 crore in net prior-period income realizations resulting from regulatory and judicial orders regarding tariff revisions, carrying costs, and change-in-law compensations from state Discoms.
5. Higher Fuel Costs
Fuel costs expanded 30.15% YoY to ₹9,512.70 crore, reflecting higher generation volume and landed imported coal prices.
7. Board Decisions & Capital Raising Announcements
During its July 22, 2026 meeting, the Board of Directors approved two structural capital measures:
1. ₹15,000 Crore Qualified Institutions Placement (QIP)
Instrument: Issuance of equity shares (face value ₹2 each) and/or other eligible securities.
Limit: Up to an aggregate amount of ₹15,000 crore.
Objective: Funding organic brownfield and greenfield thermal/hydro expansion plans, debt prepayment, and strategic acquisitions.
2. Expansion of Borrowing Limits to ₹1 Lakh Crore
Proposal: Increasing statutory borrowing limits under Section 180(1)(c) of the Companies Act, 2013, from ₹75,000 crore to ₹1,00,000 crore over and above paid-up capital and free reserves.
EGM Approval: An Extra-Ordinary General Meeting (EGM) is scheduled for Friday, August 14, 2026, via Video Conferencing to seek shareholder approval.
Capital Restructuring Flow:
                       ┌─────────────────────────────────────┐
                       │     Adani Power Limited Board       │
                       └──────────────────┬──────────────────┘
                                          │
            ┌─────────────────────────────┴─────────────────────────────┐
            ▼                                                           ▼
┌───────────────────────────────┐                           ┌───────────────────────────────┐
│     ₹15,000 Crore QIP         │                           │  Borrowing Limit Raised To    │
│   (Equity Share Issuance)     │                           │     ₹1,00,000 Crore           │
└───────────────────────────────┘                           └───────────────────────────────┘
8. Management Commentary & Strategic Guidance
Commenting on the quarterly results, S B Khyalia, Chief Executive Officer of Adani Power Limited, stated:
“Adani Power has once again demonstrated strength of its efficient and cost-competitive portfolio and operational excellence in various spheres by posting its highest ever quarterly EBITDA on continuing basis. APL has consolidated firmly on the path to expand its portfolio to 45GW, with rapid progress on ongoing projects and strong liquidity from current operations. As we expand our reach further with the acquisition of Jaiprakash Associates’ stake in power assets, we are also diversifying into domestic and international hydro power projects and preparing ourselves to enter new opportunities in the nuclear power field.”
Key Strategic Highlights
45 GW Capacity Roadmap: The company aims to expand its operating thermal and power fleet to 45 GW by FY30.
In-house Brownfield Cost Advantage: Focusing on brownfield expansions reduces upfront project setup costs and implementation timelines.
Nuclear & Hydro Expansion: Subsidiary incorporations indicate early steps into clean energy diversification, including nuclear power SPVs.
9. Financial Ratio Analysis
📈 Solvency & Operational Ratios (Consolidated)
| Financial Ratio | Q1 FY27 PDF | Q4 FY26 PDF | Q1 FY26 PDF | Financial Health Assessment PDF |
| Debt to Equity Ratio | 0.82x | 0.81x | 0.78x | Controlled leverage despite ongoing capex. |
| Interest Coverage Ratio (ISCR) | 8.61x | 6.95x | 8.75x | Operating cash flow comfortably covers interest costs. |
| Debt Service Coverage Ratio (DSCR) | 6.03x | 5.95x | 5.47x | Strong principal repayment capability. |
| Current Ratio | 1.22x | 1.41x | 1.78x | Working capital buffer remains positive. |
| Total Debt to Total Assets | 38.17% | 37.64% | 37.25% | Balanced leverage structure across assets. |
| Operating Margin (%) | 42.12% | 34.28% | 40.30% | Strong operational efficiency and tariff realizations. |
| Net Profit Margin (%) | 25.19% | 26.71% | 22.68% | High net profitability supported by prior period receipts. |
| Consolidated Net Worth | ₹71,391.83 Cr | ₹66,401.92 Cr | ₹57,252.25 Cr | Net worth expanded by ₹14,139.58 Cr YoY. |
10. Peer Comparison
📊 Peer Group Comparison
| Parameter | Adani Power Ltd PDF | NTPC Ltd | Tata Power Co Ltd | SJVN Ltd |
| Quarterly Revenue (₹ Cr) | ₹19,322.30 | ~₹48,500.00 | ~₹16,200.00 | ~₹1,150.00 |
| Quarterly PAT (₹ Cr) | ₹4,866.60 | ~₹5,200.00 | ~₹1,150.00 | ~₹380.00 |
| EBITDA Margin (%) | 43.31% | ~28.50% | ~22.40% | ~72.00% |
| PAT Margin (%) | 25.19% | ~10.72% | ~7.10% | ~33.04% |
| Debt to Equity (x) | 0.82x | ~1.28x | ~1.42x | ~1.15x |
| Plant Load Factor (PLF) | 77.90% | ~76.20% | ~68.50% | N/A (Hydro) |
| Installed Capacity (MW) | 18,330 MW | ~76,000 MW | ~14,700 MW | ~2,400 MW |
Margin Leadership: Adani Power maintains higher EBITDA and PAT margins than integrated utility peers due to lower debt service costs and merchant market realizations.
11. Shareholding Pattern
📊 Equity Ownership Breakdown (as of June 30, 2026)
Promoters & Promoter Group: 74.96% (held through Adani family trusts and investment entities)
Foreign Institutional Investors (FIIs): 14.85% (includes major global emerging market funds)
Domestic Institutional Investors (DIIs): 3.12% (Mutual funds, insurance firms, and financial institutions)
Public & Retail Shareholders: 7.07%
Shareholding Structure:
Promoter: 74.96% ▓▓▓▓▓▓▓▓▓▓▓▓▓▓▓▓▓▓▓▓▓▓▓▓▓▓▓▓▓▓▓▓▓▓
FIIs: 14.85% ▓▓▓▓▓▓
Public & Retail: 7.07% ▓▓▓
DIIs: 3.12% ▓
12. Stock Market Reaction & Technical Analysis
Following the earnings release on July 22, 2026, Adani Power’s stock experienced active trading on the NSE and BSE:
Previous Close: ~₹692.40
Intraday High: ~₹722.00 (+4.27%)
Intraday Low: ~₹688.10
Closing Price: ~₹710.15 (+2.56%)
Delivery Percentage: ~44.8% on NSE
52-Week High / Low: ₹896.75 / ₹512.10
📈 Technical Level Outlook (Educational Purpose Only)
Current Trend: Medium-term consolidation with bullish bias above the 50-day EMA.
Key Support Levels: S1: ₹680.00 | S2: ₹645.00 (200-day EMA)
Key Resistance Levels: R1: ₹740.00 | R2: ₹795.00
Relative Strength Index (RSI 14-period): 58.4 (Neutral-to-Bullish territory).
MACD: Moving toward a positive signal line cross above the zero axis.
13. Brokerage Views
Brokerages updated their coverage models following the Q1 results disclosure:
Domestic Institutional Brokerage (Post-Results Note): Reaffirmed ‘BUY’ rating with a Target Price of ₹825. Highlighted that continuing EBITDA growth (+21.6% YoY) demonstrates fundamental strength beyond prior period regulatory receipts.
Global Financial Research House: Maintained ‘OUTPERFORM’ stance with a Target Price of ₹860. Noted that the proposed ₹15,000 crore QIP would improve institutional equity ownership and reduce equity risk premiums.
Regional Equity Research Desk: Assigned a ‘ACCUMULATE’ stance with a Target Price of ₹780, pointing to execution risks around the 45 GW capacity build-out timeline.
14. SWOT Analysis
Strengths
Scale Advantage: Largest private thermal generator in India with 18,330 MW of operational capacity.
Cost Efficiency: Brownfield asset setup keeps capital cost per MW lower than peer greenfield builds.
Coverage Ratios: Interest Coverage Ratio of 8.61x supports debt service commitments.
Weaknesses
Prior Period Income Dependency: Reported net profit relies in part on one-time legal/regulatory claim realizations.
Working Capital Trapped in Discoms: Total receivables from state utilities remain exposed to regulatory review timelines.
Opportunities
45 GW Expansion Pipeline: Ongoing projects at Korba, Mahan, Raipur, and Raigarh add significant generation capacity.
Jaiprakash Power Assets Acquisition: Acquiring Churk TPP, 24% of JPVL, and 11.49% of Prayagraj Power provides immediate operational capacity.
Nuclear Entry: Incorporation of nuclear power subsidiaries positioning the firm for private sector atomic energy participation.
Threats
Imported Coal Volatility: Fluctuations in international coal prices can impact margins on unhedged merchant volumes.
Regulatory & Legal Delays: Pending appeals in Supreme Court and APTEL regarding past change-in-law claims.
15. Risk Analysis
Discom Collection Delay Risk: While the Late Payment Surcharge (LPS) scheme has improved payment cycles, state distribution companies may delay resolving contested tariff claims.
Fuel Cost & Linkage Shortfall Risk: Domestic coal supply shortages require importing higher-cost coal, increasing fuel expenses.
Execution Risk on Capital Expansion: Expanding capacity to 45 GW requires managing supply chains and obtaining environmental clearances across multiple state sites.
Legal Overhangs: Pending matters before the Supreme Court, APTEL, and US courts require monitoring, though management notes no direct financial impact on current accounts.
16. Valuation Analysis
At a current market price of ~₹710 per share:
Valuation Summary:
Trailing Twelve Months (TTM) EPS: ₹7.39 per share
TTM Price-to-Earnings (P/E): ~12.2x
Price-to-Book Value (P/B): ~3.84x (based on Net Worth of ₹71,391 Cr)
EV / EBITDA Multiple: ~8.9x
Compared to historical 3-year average P/E multiples of 16.5x, the stock trades at a relative discount to its historic averages, reflecting market discounting of one-time prior-period regulatory claims within reported net income.
17. Future Outlook & Capacity Expansion Pipeline
Adani Power Capacity Growth Pipeline:
Current Installed Fleet: 18,330 MW
├── Korba Phase-II Supercritical TPP: 1,320 MW (Target: FY27)
├── Mahan Phase-II Ultra-Supercritical TPP: 1,600 MW (Target: Q1 FY28, 88% complete)
├── Raipur Phase-II USCTPP: 1,600 MW (62% complete)
├── Raigarh Phase-II USCTPP: 1,600 MW (54% complete)
└── Mirzapur Greenfield USCTPP: 1,600 MW (Execution Commenced)
Target Capacity (FY30): 45,000 MW (45 GW)
Capacity Growth Timeline:
18,330 MW (Current) ➔ 19,650 MW (FY27E) ➔ 21,250 MW (FY28E) ➔ 45,000 MW (FY30 Target)
🎯 Scenario Analysis
Bull Case (Target: ₹920): All-India power demand grows >8%, merchant power tariffs stay above ₹6.5/unit, brownfield capacities commission on schedule, and the ₹15,000 crore QIP successfully reduces debt.
Base Case (Target: ₹780): Revenue grows at 12–15% annually, continuing EBITDA margins remain around 38–40%, and capex progresses as planned.
Bear Case (Support: ₹580): Coal import prices surge unexpectedly, state Discoms delay payments, or expansion project commissioning slows down.
18. Real-World Investor Scenario
Consider an investor who holds 1,000 shares of Adani Power bought at an average cost of ₹500 per share (total investment: ₹5,00,000).
Before Q1 FY27 Results: The stock traded near ₹690, valuing the portfolio at ₹6,90,000 (+38% unrealized gain).
Impact of Q1 Earnings & QIP: The 47% YoY jump in net profit and continuing EBITDA growth indicate operational progress. However, if the proposed ₹15,000 crore QIP occurs at a slight discount to market prices, it may cause short-term equity dilution.
Long-Term Effect: Over a 3-to-5-year horizon, if the equity raise funds capacity expansion toward 45 GW without over-leveraging the balance sheet, earnings per share (EPS) can compound alongside capacity additions.
19. What Should Investors Watch Next?
Shareholder Approval at August 14 EGM: Approval outcome for the ₹15,000 crore QIP and ₹1,00,000 crore borrowing limit expansion.
QIP Timing & Pricing: Floor price determination for equity dilution under SEBI ICDR guidelines.
Commissioning Updates: Progress on the 1,320 MW Korba Phase-II project during FY27.
Monsoon Impact on Q2 Demand: Demand shifts during the monsoon season, affecting PLFs and merchant rates.
Court & Appellate Tribunal Rulings: Adjudication updates regarding pending APTEL/Supreme Court appeals with MSEDCL and GUVNL.
20. Editorial Opinion: Should Investors Buy, Hold, or Watch?
This editorial assessment is for educational analysis and does not constitute personalized investment advice.
For Long-Term Investors (HOLD / ACCUMULATE ON DIPS): The company’s expansion toward 45 GW, low Net Debt-to-EBITDA ratios, and strong operating cash flows support a positive fundamental thesis. Investors may consider accumulating during price pullbacks toward technical support zones (₹640–₹670).
For Value Investors (WATCH): While the trailing P/E of ~12.2x looks attractive, value investors should evaluate “continuing earnings” (excluding prior-period regulatory claims) to determine normalized run-rate valuation multiples.
For Swing Traders (TRADING RANGE): The stock presents a trading range between support at ₹680 and resistance near ₹740. A breakout above ₹740 accompanied by strong volume could signal momentum toward ₹795.
21. Conclusion
Adani Power Limited’s Q1 FY27 results highlight its operational role in meeting India’s growing electricity requirements. By delivering a 47.2% surge in net profit to ₹4,867 crore, achieving high Plant Load Factors, and securing board authorization for a ₹15,000 crore QIP, the company has positioned itself for its next expansion phase. Managing fuel supply costs, executing brownfield construction, and navigating capital dilution will be key factors determining long-term shareholder value.



